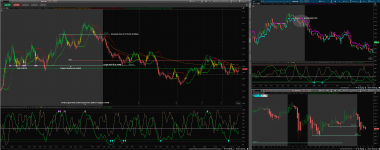
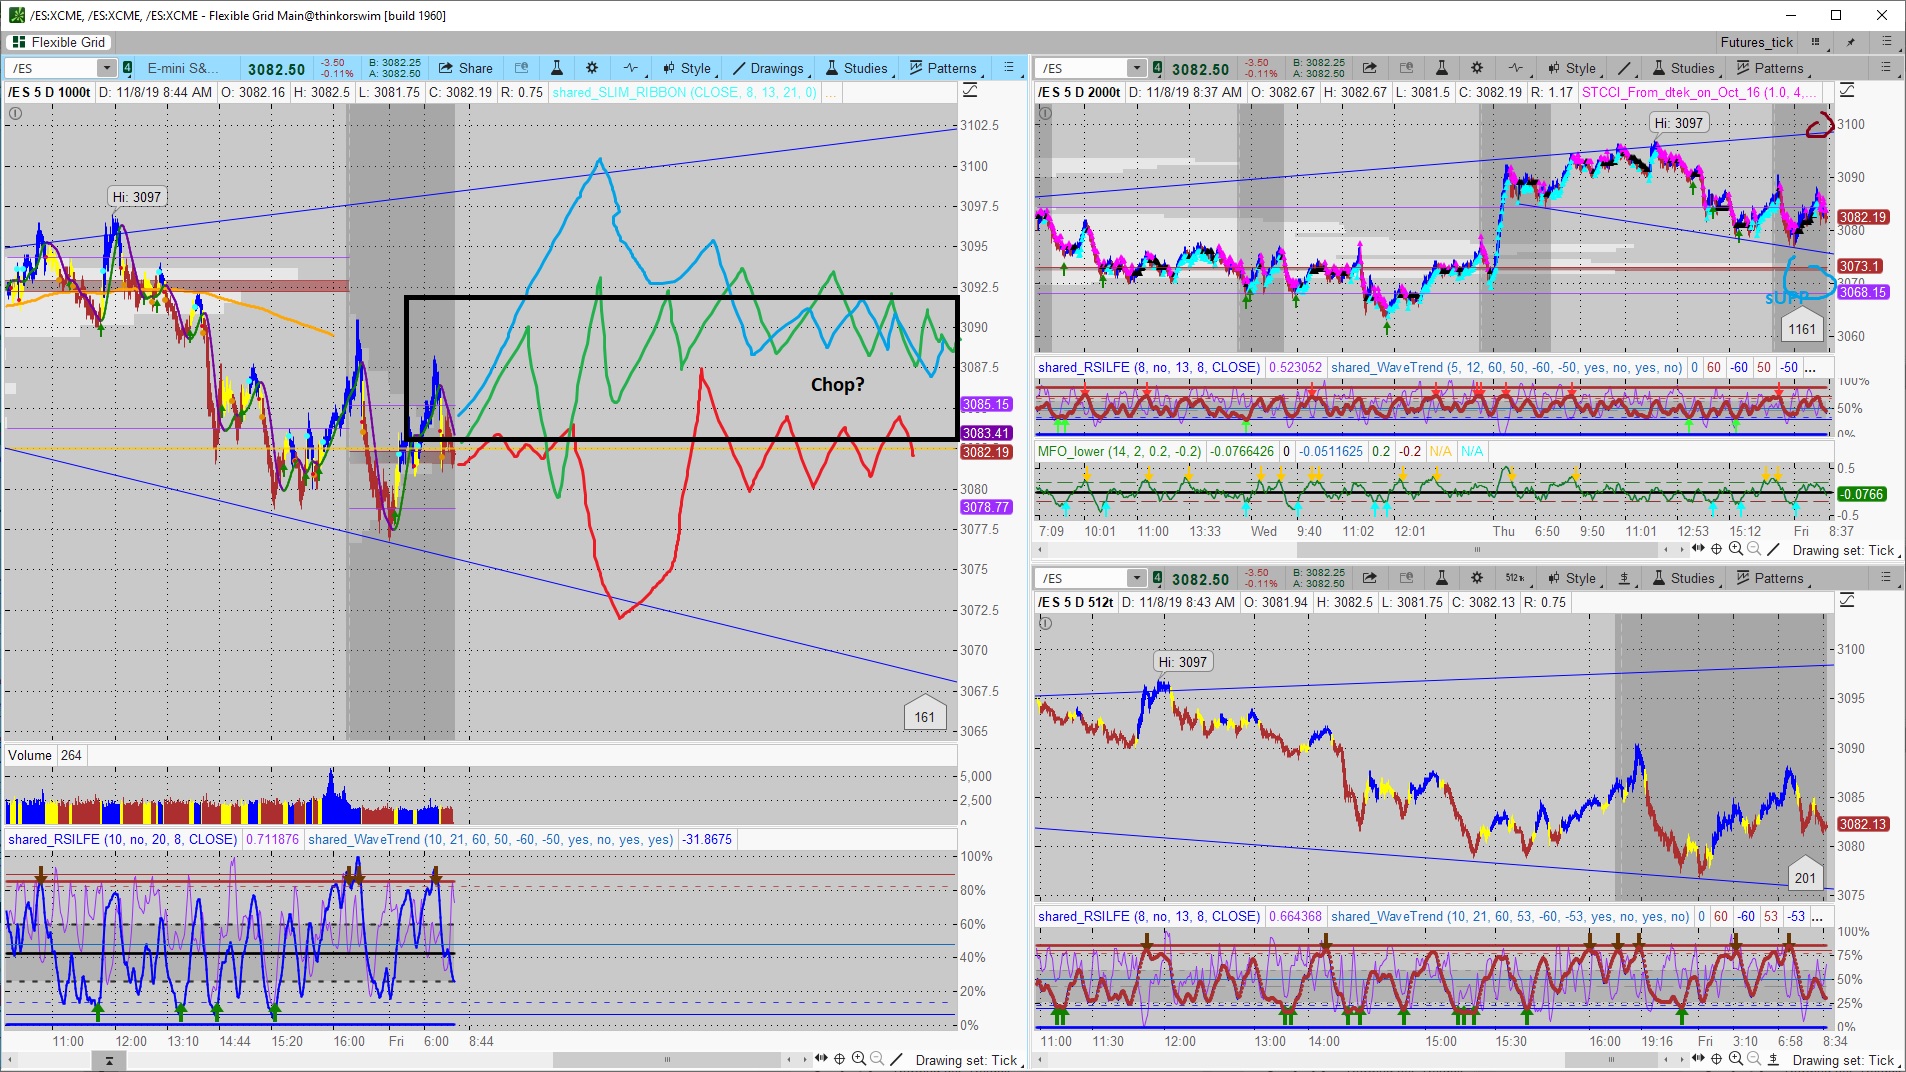
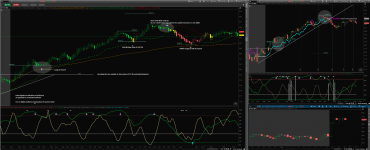
/ES Futures Trading Strategy on ThinkorSwim

Wasn't going to pass on this play again like I did on Tuesday morning. Only trade of the day so far.

KuLEktf.png
 

Attachments

  • KuLEktf.png
    KuLEktf.png
    408.6 KB · Views: 116

New Indicator: Buy the Dip

Check out our Buy the Dip indicator and see how it can help you find profitable swing trading ideas. Scanner, watchlist columns, and add-ons are included.

Download the indicator

Join useThinkScript to post your question to a community of 21,000+ developers and traders.

I found this website last week, and I do think it is amazing. However, I do have a question. If I use this link it works great for stocks with lots of volume. However, I get little lines when I try certain stocks which are hard to read. I assume I can change the 5D-1000t setting to make it look better. Has anyone found another setting which works better on stocks with less volume?
https://tos.mx/mWfhOCS
333 is good for most stocks. However IMHO this strat is not directly applicable to stocks as they trade in different patterns than /ES
 
I really liked the idea that @XeoNoX had of hiding bars that are under 2.0 times the relative volume (RelativeVolumeStDev). So I took the same kind of logic and applied it to Freedom Of Movement. Overlay that with my current setup on the 1000t and 2000t chart: FOM shown as wedges and Volume as standard bars. The dashed vertical lines on the 2000t were when both FOM and Vol moved above two std dev on the same candle.....pretty interesting results. Let me know what you guys think✊.

hKcNpdR.png


GGR5IAG.png
 

Attachments

  • GGR5IAG.png
    GGR5IAG.png
    374.2 KB · Views: 73
  • hKcNpdR.png
    hKcNpdR.png
    356.3 KB · Views: 80
I really liked the idea that @XeoNoX had of hiding bars that are under 2.0 times the relative volume (RelativeVolumeStDev). So I took the same kind of logic and applied it to Freedom Of Movement. Overlay that with my current setup on the 1000t and 2000t chart: FOM shown as wedges and Volume as standard bars. The dashed vertical lines on the 2000t were when both FOM and Vol moved above two std dev on the same candle.....pretty interesting results. Let me know what you guys think✊.

I did some testing and reflection and imho neither FOM neither relstddev volume make much sense on tick chart. - On a tick chart volume is roughly same on every bar (because every bar is fixed amount of orders)
FOM makes a bit of sense - because part of its relative range . And since volume is about same its effectively relative stdev of atr indicator.
But volume is just bogus signals
 
@blakecmathis here's the way I personally use this setup.

Green candle = long signal (or close out short), sell when red candles appear on chart, or for significant resistance levels.

Red candle = short signal (or close out long), sell when green candles appear, or for significant support levels.

To everyone out there, no need to over complicate your strategy. Don't get analysis paralysis.

Yes, there will be rocky trades in between but you will catch the big moves which far surpass the smaller chop.
 
@corello For me personally, the slim ribbon coloring of the candles is more for psychological support. I don't ever enter or exit a trade just simply based on the color of one candle. But I think that's why this setup has been so successful because it really is beyond simple my dude.
 
@blakecmathis here's the way I personally use this setup.

Green candle = long signal (or close out short), sell when red candles appear on chart, or for significant resistance levels.

Red candle = short signal (or close out long), sell when green candles appear, or for significant support levels.

To everyone out there, no need to over complicate your strategy. Don't get analysis paralysis.

Yes, there will be rocky trades in between but you will catch the big moves which far surpass the smaller chop.

Meh. This setup would be of no value if it was like that. If you want scalp based on "feel" and can emotionally handle it - god bless you.
The whole point of rule based system is to minimize the amount of bad RR entries. Emotional stops, revenge trading, overtrading etc
If you do a few trades and you get chopped out - the emotional damage those stops cause will likely destroy your readiness for next right play. its better to have very precise, strict system which generates very few signals and misses a lot than having a system which gives a lot of "entries" (which is what "long green - short red" is).

Of course there are successful scalpers who succeed in the simple approach. But its their very personal edge, not systematical approach transferable to anyone else. Its more of quick intuition type game for them. They also dont care much about RR and take profits quick (which is the actual edge - if you take profits quick you dont get stop out)
their whole edge comes from experience in seeing setups and execution . They enter fast and take profits fast. They dont catch trend(most often its no use for them - whole play is done under 5 minutes ) - its not the point. "get green -get out" is their motto. Their whole system is in their head and their edge is that they have emotional discipline to trade this way .
Most people who see signal/setup - want to jump on it. And in 90% of time that is precisely wrong thing to do (because most simple signals most people use are wrong most of the time)

I personally struggle psychological with discipline in real time and what helps is having clear signals on my chart . Which I backtested beforehand, analyzed and know they work. I have a rule when in position " when in doubt -trail it out" - which means move stop precisely to my trailstop indicator - no more, no less. So its paramount to have a such indicator on my chart and not wildly press buttons every time a 1/5 min candles go opposite way
 
Last edited:
Today is Friday, pre-holiday weekend. I dont really like market playing as odds off choppy ranged without clean setups are very high.
The fast low volume fake out pullback to 3055 by 10, base, W and rally would be preferred play thesis. Very likely market will die in PM
Here is premarket thesis

jV2qtRB.jpg
which indicator on TOS are you using for volume?
 
@Talochka As of today and over the entire use of this strategy, zero volume indicators have been used aside from the test on friday which provided no substantial contribution to the current setup to validate an inclusion.
 
@Talochka The arrows are buy signals from the Wave Trend Oscillator which can be found earlier in this thread. But be careful dude, be patient. Don't jump in immediately. Wait for confirmation of the trend change with a pull back and confirmation from the CCI combo. Pair that with what @skynetgen mentioned about a precise stop loss, S/R, price action, and a good mental state, you will come out in the black at the end of the day. The best trades I've ever made are when all my bills are paid, 8 hours of sleep, kiss the wife goodbye in the morning on good terms with any problems put to rest.
 
@blakecmathis

I have been watching charts with your indicators, around 1020am today, would you have gone short? If not, what would have prevented it? Chart attached, thanks!
mnUzpLT.png
 

Attachments

  • mnUzpLT.png
    mnUzpLT.png
    503 bytes · Views: 63
Last edited by a moderator:
@LouChez @DaGekko I mentioned the coloring of the candles and how they pertain to this setup a few posts back. Just because the CCI simply changes color that does not mean open a position.Gotta pay attention to S/R and price action my man. These are merely tools to accompany the greatest indicator of all: your eyes.
 

Not the exact question you're looking for?

Start a new thread and receive assistance from our community.

87k+ Posts
587 Online
Create Post

The Market Trading Game Changer

Join 2,500+ subscribers inside the useThinkScript VIP Membership Club
  • Exclusive indicators
  • Proven strategies & setups
  • Private Discord community
  • ‘Buy The Dip’ signal alerts
  • Exclusive members-only content
  • Add-ons and resources
  • 1 full year of unlimited support

Frequently Asked Questions

What is useThinkScript?

useThinkScript is the #1 community of stock market investors using indicators and other tools to power their trading strategies. Traders of all skill levels use our forums to learn about scripting and indicators, help each other, and discover new ways to gain an edge in the markets.

How do I get started?

We get it. Our forum can be intimidating, if not overwhelming. With thousands of topics, tens of thousands of posts, our community has created an incredibly deep knowledge base for stock traders. No one can ever exhaust every resource provided on our site.

If you are new, or just looking for guidance, here are some helpful links to get you started.

What are the benefits of VIP Membership?
VIP members get exclusive access to these proven and tested premium indicators: Buy the Dip, Advanced Market Moves 2.0, Take Profit, and Volatility Trading Range. In addition, VIP members get access to over 50 VIP-only custom indicators, add-ons, and strategies, private VIP-only forums, private Discord channel to discuss trades and strategies in real-time, customer support, trade alerts, and much more. Learn all about VIP membership here.
How can I access the premium indicators?
To access the premium indicators, which are plug and play ready, sign up for VIP membership here.
Back
Top