
Author Message:
Overview
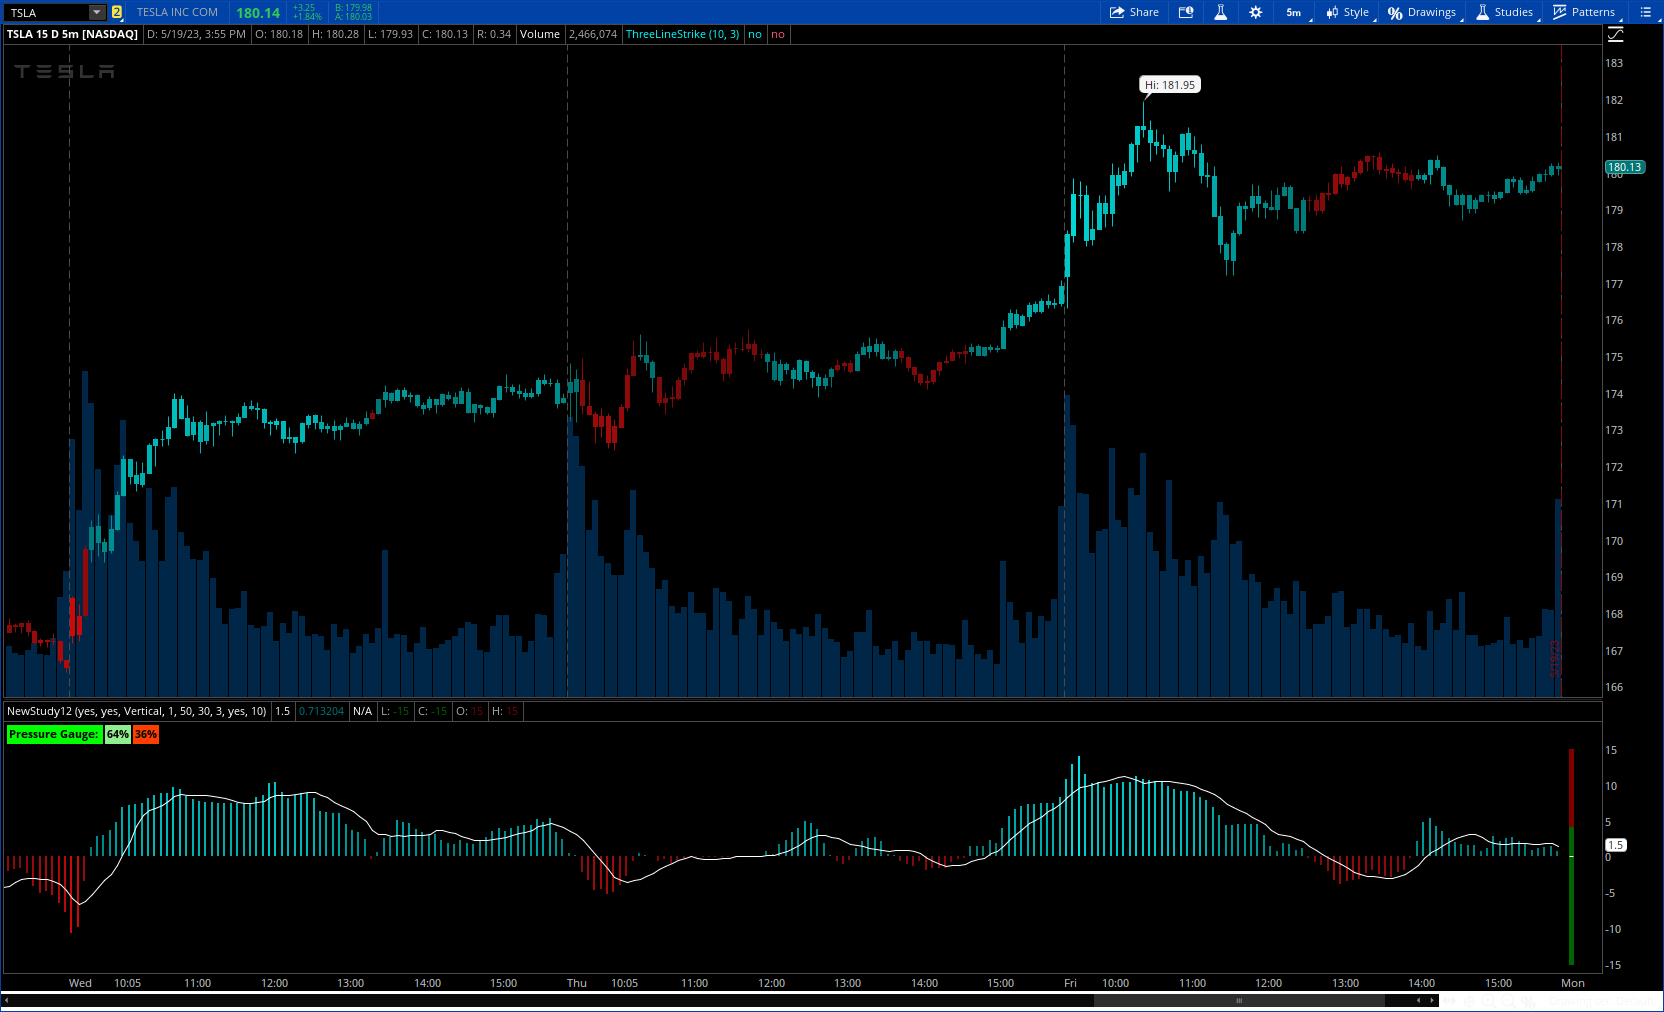
Equilibrium is a tool designed to measure the buying & selling pressure in the market. It is depicted as a “pressure gauge” that automatically adjusts as new candles are formed, providing a real-time indication of who's on top right now, buyers or sellers?
How to use it
- The indicator is designed as a pressure gauge that moves up(vertical alignment) or to the right(horizontal alignment) as the buying pressure increases, and moves down or to the left as the selling pressure increases. How it is to be used & applied, that completely depends on your trading methodology. But, the general idea is that we expect the market to be in a state of equilibrium, and if that is not the case the tool will highlight that, and this is also where the opportunity lies to find suitable trades.
- Just by having an idea about who’s dominating the market currently, a trader can also pick sides wisely. Remember, the market is always striving to come back a state of equilibrium, and a slight imbalance can indicate the current trend, and more importantly, who’s more likely to make the next move.
CODE:
CSS:
#// This source code is subject to the terms of the Mozilla Public License 2.0 at https://mozilla.org/MPL/2.0/
#// © sudoMode
#indicator(title = 'Pressure Gauge', shorttitle = 'Equilibrium', overlay = false)
# Converted and mod by Sam4Cok@Samer800    - 05/2023
declare lower;
#// gauge settings
input BarColor   = yes;
input gaugeLabel = yes;                # 'Show Gauge'
input GaugeAlignment  = {Default "Vertical", "Horizontal", "Don't Show Gauge"}; # 'Alignment'
input NumberOfVerticalGaugeBars = 1;
input GaugeLookbackPeriod = 50;        # 'Lookback Period'
input oscillatorLookbackPeriod = 30;   # 'Lookback Period'
input short_ma_length     = 3;         # 'Short MA Length'
input show_long_ma        = no;        # 'Show Long MA'
input long_ma_length      = 10;        # 'Long MA Length'


def na = Double.NaN;
def n = NumberOfVerticalGaugeBars + 1;
def vertical = GaugeAlignment==GaugeAlignment."Vertical";
def Horizontal = GaugeAlignment==GaugeAlignment."Horizontal";
#--- Color
#scaler(_series, minimum = -1, maximum = 1) =>
Script scaler {
input _series = close;
input minimum = -1;
input maximum = 1;
    def _min   = LowestAll(_series);
    def _max   = HighestAll(_series);
    def _range = _max - _min;
    def scaler = ((_series - _min) / _range) * (maximum - minimum) + minimum;
    plot out = scaler;
}
#// compute length distribution of red & green candles
#candle_distribution(red, green) =>
script candle_distribution {
    input red = close;
    input green = close;
    def scale = 25;
    def total = red + green;
    def value = (red / total) * scale;
    def dist_red = if value>0 then floor(value) else if value<0 then Ceil(value) else 0;
    def dist_green  = scale - dist_red;
    plot dRed = dist_red;
    plot dgreen = dist_green;
}
#// compute total candle lengths for the given lookback period
#compute_lengths(lookback) =>
script compute_lengths {
    input lookback = 30;
    def red1;#   = 0
    def green1;# = 0
        green1 = fold i=0 to lookback +1 with p do
              if ((close[i] - open[i])*volume[i]) >0 then p + floor((close[i] - open[i])*volume[i]) else p;
        red1 = fold j= 0 to lookback  +1 with q do
              if ((close[j] - open[j])*volume[j])<=0 then q + Ceil(AbsValue((close[j] - open[j])*volume[j])) else q;
    plot red = red1;
    plot green = green1;
}
def red_oscillator   = compute_lengths(oscillatorLookbackPeriod).red;
def green_oscillator = compute_lengths(oscillatorLookbackPeriod).green;
def dist_red_oscillator = candle_distribution(red_oscillator, green_oscillator).dred;
def dist_green_oscillator = candle_distribution(red_oscillator, green_oscillator).dgreen;
def raw_pressure    = dist_green_oscillator - dist_red_oscillator;
#def ScalUp = ? scaler(raw_pressure, -1, 0) : scaler(raw_pressure, 0, 1)
def scaled_pressure = scaler(raw_pressure, -15, 15);
def short_pressure = ExpAverage(scaled_pressure, short_ma_length);
def long_pressure  = Average(scaled_pressure, long_ma_length);

plot ma = if show_long_ma then long_pressure else na;
ma.SetDefaultColor(Color.WHITE);

plot Hist = short_pressure;
def colDn = scaler(short_pressure, 225, 10);
def colUp = scaler(short_pressure, 10, 225);

Hist.AssignValueColor(if short_pressure<0 then CreateColor(colDn, 10, 10) else CreateColor(0, colUp, colUp));
Hist.SetPaintingStrategy(PaintingStrategy.HISTOGRAM);

#-- LAbel
def red_gauge   = compute_lengths(GaugeLookbackPeriod).red;
def green_gauge = compute_lengths(GaugeLookbackPeriod).green;
def dist_red_gauge = candle_distribution(red_gauge, green_gauge).dred;
def dist_green_gauge = candle_distribution(red_gauge, green_gauge).dgreen;

def perRed = Round(dist_red_gauge * (100/25), 0);
def perGreen = Round(dist_green_gauge * (100/25), 0);
def sint = perGreen>perRed;

AddLabel(gaugeLabel, "Pressure Gauge: ", if perGreen>perRed then Color.GREEN else
                                if perGreen<perRed then Color.RED else Color.GRAY);
AddLabel(gaugeLabel, perGreen + "%", Color.LIGHT_GREEN);
AddLabel(gaugeLabel, perRed + "%", Color.LIGHT_RED);

#-- Bar Color
AssignPriceColor(if !BarColor then Color.CURRENT else
                 if short_pressure<0 then CreateColor(colDn, 10, 10) else CreateColor(0, colUp, colUp));

#-- Gague
Script scalerG {
input series = close;
input minimum = -20;
input maximum = 20;
input dir = 0;
    def range = maximum - minimum;
    def rngPer = range*series/100;
    def scalerUp = minimum + rngPer;
    def scalerDn = maximum - rngPer;
    plot out = if dir>0 then scalerUp else scalerDn;
}
def last = isNaN(close);
def width = last and isNaN(close[n+1]);
def pos = if vertical then 15 else 20;#pos_ + 5;
def neg = if vertical then -15 else 15;#pos_;
def GaugeUp = scalerG(perGreen,neg , pos, 1);
def GaugeDn = scalerG(perRed, neg, pos, -1);
def mid = (pos + neg) / 2;

plot midGauge = if vertical then
                if !last[1] then na else if !width[-1] then mid else na else
                if Horizontal then if last then na else mid else na;
midGauge.SetDefaultColor(Color.WHITE);
midGauge.SetPaintingStrategy(PaintingStrategy.DASHES);
def candleUp = if vertical then if !last[1] then na else GaugeUp[n] else GaugeUp;
def candleDn = if vertical then if !last[1] then na else GaugeDn[n] else GaugeDn;

AddChart(high = candleUp, low = neg , open = candleUp,  close = neg,
         type = ChartType.CANDLE, growcolor = Color.DARK_GREEN);
AddChart(high = pos, low = candleDn , open = pos,  close = candleDn,
         type = ChartType.CANDLE, growcolor = Color.DARK_RED);

#---") pointing out my proclivity of hacking away on the TOS!).. Note my chart if poste shows PST, but for the convenience of the Thread you can see the following: from 9:30 EST to 12:12 EST the QQQ was a plus 5.35 pt advance or 63% of the total range of Low of 3340.55 at 6:30 to High of 3.49.25 at 3:09 PM EST.
pointing out my proclivity of hacking away on the TOS!).. Note my chart if poste shows PST, but for the convenience of the Thread you can see the following: from 9:30 EST to 12:12 EST the QQQ was a plus 5.35 pt advance or 63% of the total range of Low of 3340.55 at 6:30 to High of 3.49.25 at 3:09 PM EST.