EMA Histogram For ThinkOrSwim

mbarcala

Active member
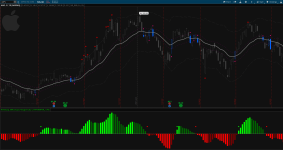
This its EMA Histogram, a nice combination between a moving average as histogram in a lower indicator. I remember I saw something like this a while ago on tradingview and now a friend is asking me if he can use a moving average as a lower indicator so I wrote this to help him, it's nice the finish idea. Its fully customizable in case the you want to change your trading timeframe.

Upper Indicator here: https://usethinkscript.com/threads/break-keltner-bands-bkb-for-thinkorswim.11220/

14817[/ATTACH]']
vwEB41z.png


script
Code:
# EMA Histogram by mbarcala

declare lower;

input length = 20;
input fastPeriod = 5;
input averageType = AverageType.EXPONENTIAL;
input signLevel = 0.45;
input showLevel = no;

def exma = MovingAverage(averageType, close, length);

plot EMAh = (exma - exma[fastPeriod]) / fastPeriod;
EMAh.SetPaintingStrategy(PaintingStrategy.HISTOGRAM);
EMAh.AssignValueColor(if EMAh > EMAh[1] and EMAh > 0 then Color.GREEN else
                       if EMAh > 0 and EMAh < EMAh[1] then Color.DARK_GREEN else
                       if EMAh < 0 and EMAh < EMAh[1] then Color.RED else Color.DARK_RED);
EMAh.SetLineWeight(5);
EMAh.HideBubble();
EMAh.HideTitle();

plot zcero = 0;
zcero.SetDefaultColor(Color.GRAY);
zcero.HideTitle();

def signUp = if EMAh crosses above 0 or EMAh crosses below 0 then signLevel else Double.NaN;
def signUpDn = if EMAh crosses above 0 then signLevel else if EMAh crosses below 0 then -signLevel else Double.NaN;

plot levels = if showLevel == 1 then signUp else signUpDn;
levels.SetPaintingStrategy(PaintingStrategy.SQUARES);
levels.AssignValueColor(if EMAh crosses above 0 then Color.GREEN else if EMAh crosses below 0 then Color.RED else Color.CURRENT);
levels.SetLineWeight(3);
levels.HideBubble();
levels.HideTitle();
 

Attachments

  • vwEB41z.png
    vwEB41z.png
    439 KB · Views: 115
Last edited by a moderator:

Join useThinkScript to post your question to a community of 21,000+ developers and traders.

Similar threads

Not the exact question you're looking for?

Start a new thread and receive assistance from our community.

87k+ Posts
414 Online
Create Post

Similar threads

Similar threads

The Market Trading Game Changer

Join 2,500+ subscribers inside the useThinkScript VIP Membership Club
  • Exclusive indicators
  • Proven strategies & setups
  • Private Discord community
  • ‘Buy The Dip’ signal alerts
  • Exclusive members-only content
  • Add-ons and resources
  • 1 full year of unlimited support

Frequently Asked Questions

What is useThinkScript?

useThinkScript is the #1 community of stock market investors using indicators and other tools to power their trading strategies. Traders of all skill levels use our forums to learn about scripting and indicators, help each other, and discover new ways to gain an edge in the markets.

How do I get started?

We get it. Our forum can be intimidating, if not overwhelming. With thousands of topics, tens of thousands of posts, our community has created an incredibly deep knowledge base for stock traders. No one can ever exhaust every resource provided on our site.

If you are new, or just looking for guidance, here are some helpful links to get you started.

What are the benefits of VIP Membership?
VIP members get exclusive access to these proven and tested premium indicators: Buy the Dip, Advanced Market Moves 2.0, Take Profit, and Volatility Trading Range. In addition, VIP members get access to over 50 VIP-only custom indicators, add-ons, and strategies, private VIP-only forums, private Discord channel to discuss trades and strategies in real-time, customer support, trade alerts, and much more. Learn all about VIP membership here.
How can I access the premium indicators?
To access the premium indicators, which are plug and play ready, sign up for VIP membership here.
Back
Top