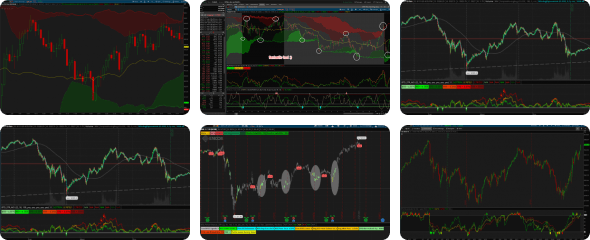

# Dynamic Support/Resistance Zones [ChartPrime] — Compact Edition

This study builds a live, volume-weighted market profile from pivots and projects the most statistically significant price levels forward as dynamic support and resistance. Instead of drawing levels from arbitrary swing points, it aggregates up to 50 pivot highs and lows across four independent swing lengths (5/10/20/50), weights them by Volume, Linear, or Time, and then smooths the resulting distribution with a normalized sinc convolution. The output is a ranked histogram of price acceptance, from which peak levels are extracted and drawn as forward-extending S/R lines, optional zones, heat-map bands, and bounce markers.
The original Pine script
https://www.tradingview.com/script/lrYnTj06-Dynamic-Support-Resistance-Zones-ChartPrime/
defaults to 75 bins. This compact port enforces a hard cap of 16 bins (3–16 range), reducing the per-bar fold workload from 75 rows to 16 and cutting the sinc kernel from 75 taps to 16. It also collapses the S/R output into 8 shared drawing slots (two adjacent bins per slot) instead of drawing every peak, and uses a shared event engine per row rather than per-bar recomputation. The result is the same analytical model — pivot aggregation, weighting, sinc filtering, peak detection — at a fraction of the ThinkScript execution cost, which is critical because ThinkScript folds are far slower than Pine arrays.
---
## How to Trade It
1. Trend continuation at support
Price pulls back into a green S/R line while the broader trend is up. Wait for a bull bounce dot (price rejects the level from below) and enter long on the next bar close above the level. Stop below the zone; target the next resistance line above.
2. Rejection at resistance
Price rallies into a red S/R line in a downtrend. A bear bounce dot prints when the wick rejects the level. Enter short on the close back below the line, stop above the zone, target the next support line.
3. Level confluence
When two or more S/R lines cluster within one bin width (
4. Distribution skew
Use the histogram and pivot average to gauge balance. If the pivot average is rising and the distribution is bottom-heavy, buyers are accepting higher prices — favor longs at support. If the average is falling and the distribution is top-heavy, favor shorts at resistance.
5. Heat-map context
Use the heat map to identify where price has spent the most weighted time. Levels inside high-acceptance bands tend to produce chop; levels at the edges of the distribution tend to produce cleaner rejections.
---
## Practical Notes
This study builds a live, volume-weighted market profile from pivots and projects the most statistically significant price levels forward as dynamic support and resistance. Instead of drawing levels from arbitrary swing points, it aggregates up to 50 pivot highs and lows across four independent swing lengths (5/10/20/50), weights them by Volume, Linear, or Time, and then smooths the resulting distribution with a normalized sinc convolution. The output is a ranked histogram of price acceptance, from which peak levels are extracted and drawn as forward-extending S/R lines, optional zones, heat-map bands, and bounce markers.
- Dynamic S/R lines — peak levels from the filtered pivot distribution, colored green (support) or red (resistance) based on the last close.
- Distribution histogram — horizontal bars sized by weighted pivot density, with a cyan→magenta gradient.
- Heat map — optional cloud bands showing low/mid/high acceptance areas.
- Score bubbles — weighted pivot counts per bin, with K/M/B unit formatting.
- Bounce dots — bull/bear rejection markers when price interacts with a level.
- Pivot average — optional SMA-smoothed mean of the filtered distribution with a layered glow.
The original Pine script
https://www.tradingview.com/script/lrYnTj06-Dynamic-Support-Resistance-Zones-ChartPrime/
defaults to 75 bins. This compact port enforces a hard cap of 16 bins (3–16 range), reducing the per-bar fold workload from 75 rows to 16 and cutting the sinc kernel from 75 taps to 16. It also collapses the S/R output into 8 shared drawing slots (two adjacent bins per slot) instead of drawing every peak, and uses a shared event engine per row rather than per-bar recomputation. The result is the same analytical model — pivot aggregation, weighting, sinc filtering, peak detection — at a fraction of the ThinkScript execution cost, which is critical because ThinkScript folds are far slower than Pine arrays.
---
## How to Trade It
1. Trend continuation at support
Price pulls back into a green S/R line while the broader trend is up. Wait for a bull bounce dot (price rejects the level from below) and enter long on the next bar close above the level. Stop below the zone; target the next resistance line above.
2. Rejection at resistance
Price rallies into a red S/R line in a downtrend. A bear bounce dot prints when the wick rejects the level. Enter short on the close back below the line, stop above the zone, target the next support line.
3. Level confluence
When two or more S/R lines cluster within one bin width (
dz), the zone is stronger. Trade bounces only at these confluences; skip isolated single-bin peaks.4. Distribution skew
Use the histogram and pivot average to gauge balance. If the pivot average is rising and the distribution is bottom-heavy, buyers are accepting higher prices — favor longs at support. If the average is falling and the distribution is top-heavy, favor shorts at resistance.
5. Heat-map context
Use the heat map to identify where price has spent the most weighted time. Levels inside high-acceptance bands tend to produce chop; levels at the edges of the distribution tend to produce cleaner rejections.
---
## Practical Notes
- Best used on a black chart background for the intended color contrast.
- Set
automaticPrecision=yesfor adaptive binning, or keepmanualPrecision=16for the compact default. calculateOnLastBarOnly=yesdisables the pivot-average history and is the fastest mode.showWarningsandshowDiagnosticsreport truncated scans, missing pivots, and zero-score conditions — always check the diagnostic label before trading.
Code:
# Dynamic Support/Resistance Zones [ChartPrime] - Compact
# Right expansion: 45 bars for defaults. Use a black chart background.
# COMPACT LIMITS / DIFFERENCES:
# 1. 3..16 bins (default 16), NOT the Pine default of 75. Automatic mode

declare upper;
declare once_per_bar;
def na=Double.NaN;

# ---------- Calculation ----------
input weighting={default Volume,Linear,Time};
input numberOfPivots=50;
input filtering=0.0;
input manualPrecision=16;
input automaticPrecision=no;
input calculateOnLastBarOnly=no;
input confirmOnClose=yes;
input searchBars=1000;

# ---------- Pivots ----------
input length1=5;
input includeLength1=yes;
input length2=10;
input includeLength2=yes;
input length3=20;
input includeLength3=yes;
input length4=50;
input includeLength4=yes;
input includePivotHigh=yes;
input includePivotLow=yes;

# ---------- Support / resistance ----------
input showSupportResistance=yes;
input showBounces=yes;
input bounceLookback=100;
input showZones=no;
input zoneTransparency=88;
input lineWeight=2;
input dashedLines=no;
input extendLeftBars=0;# 0 = all loaded bars, matching Pine extend.left
input bounceSize=2;
input bounceOffsetTicks=0;
input supportRed=0;
input supportGreen=255;
input supportBlue=0;
input resistanceRed=255;
input resistanceGreen=0;
input resistanceBlue=0;

# ---------- Distribution ----------
input showDistribution=yes;
input showDistributionScores=yes;
input distributionScale=30;
input distributionGap=3;
input distributionLineWeight=5;
input scoreBubbleOffset=3;
input scoreEveryNBins=1;
input showHeatMap=yes;
input heatTransparency=85;
input highRed=0;
input highGreen=255;
input highBlue=255;
input lowRed=255;
input lowGreen=0;
input lowBlue=255;

# ---------- Pivot level average ----------
input showPivotAverage=no;
input maSmoothing=12;# source adds 1: 12 means SMA length 13
input maHistoryBars=200;# 0 = all loaded bars; can be expensive
input showAverageGlow=yes;
input averageRed=85;
input averageGreen=54;
input averageBlue=228;

# ---------- Diagnostics ----------
input showWarnings=yes;
input showDiagnostics=yes;

Assert(numberOfPivots>=1,"numberOfPivots must be at least 1");
Assert(filtering>=0 and filtering<=12,"filtering must be 0..12");
Assert(manualPrecision>=3 and manualPrecision<=16,"manualPrecision must be 3..16");
Assert(length1>=1 and length2>=2 and length3>=3 and length4>=4,"Pivot lengths: minimums 1 / 2 / 3 / 4");
Assert(searchBars>=100 and searchBars<=4000,"searchBars must be 100..4000");
Assert(distributionScale>=5 and distributionScale<=200,"distributionScale must be 5..200");
Assert(distributionGap>=1 and scoreBubbleOffset>=0,"Expansion offsets cannot be negative; gap must be at least 1");
Assert(scoreEveryNBins>=1 and bounceLookback>=1,"Score interval and bounce lookback must be at least 1");
Assert(zoneTransparency>=0 and zoneTransparency<=100 and heatTransparency>=0 and heatTransparency<=100,"Transparency must be 0..100");
Assert(lineWeight>=1 and lineWeight<=5 and distributionLineWeight>=1 and distributionLineWeight<=5 and bounceSize>=1 and bounceSize<=5,"Line / dot weights must be 1..5");
Assert(maSmoothing>=0 and maSmoothing<=200 and maHistoryBars>=0 and extendLeftBars>=0,"MA smoothing 0..200; history / extension at least 0");

DefineGlobalColor("Support",CreateColor(supportRed,supportGreen,supportBlue));
DefineGlobalColor("Resistance",CreateColor(resistanceRed,resistanceGreen,resistanceBlue));
DefineGlobalColor("Support zone",CreateColor(supportRed*(100-zoneTransparency)/100,supportGreen*(100-zoneTransparency)/100,supportBlue*(100-zoneTransparency)/100));
DefineGlobalColor("Resistance zone",CreateColor(resistanceRed*(100-zoneTransparency)/100,resistanceGreen*(100-zoneTransparency)/100,resistanceBlue*(100-zoneTransparency)/100));
DefineGlobalColor("Pivot average",CreateColor(averageRed,averageGreen,averageBlue));
DefineGlobalColor("Glow inner",CreateColor(averageRed*0.6,averageGreen*0.6,averageBlue*0.6));
DefineGlobalColor("Glow middle",CreateColor(averageRed*0.35,averageGreen*0.35,averageBlue*0.35));
DefineGlobalColor("Glow outer",CreateColor(averageRed*0.15,averageGreen*0.15,averageBlue*0.15));
DefineGlobalColor("Heat 0",CreateColor((lowRed+(highRed - lowRed)*0)*(100 - heatTransparency)/100,(lowGreen+(highGreen - lowGreen)*0)*(100 - heatTransparency)/100,(lowBlue+(highBlue - lowBlue)*0)*(100 - heatTransparency)/100));
DefineGlobalColor("Heat 2",CreateColor((lowRed+(highRed - lowRed)*0.5)*(100 - heatTransparency)/100,(lowGreen+(highGreen - lowGreen)*0.5)*(100 - heatTransparency)/100,(lowBlue+(highBlue - lowBlue)*0.5)*(100 - heatTransparency)/100));
DefineGlobalColor("Heat 4",CreateColor((lowRed+(highRed - lowRed)*1)*(100 - heatTransparency)/100,(lowGreen+(highGreen - lowGreen)*1)*(100 - heatTransparency)/100,(lowBlue+(highBlue - lowBlue)*1)*(100 - heatTransparency)/100));
script Sinc {
    input distance=0;
    input amount=3.0;
    def x=Double.Pi*distance/(amount+1);
    plot Value=if distance==0 then 1 else if amount<=0 then 0 else Sin(x)/x;
}

# Ties: candidate may equal an older high/low but must beat newer bars.
script Pivot {
    input span=5;
    input delay=1;
    def enough=BarNumber()>2*span+delay;
    def h=GetValue(high,span+delay,span+delay);
    def l=GetValue(low,span+delay,span+delay);
    def newerH=Highest(GetValue(high,delay,delay),span);
    def olderH=Highest(GetValue(high,span+delay+1,span+delay+1),span);
    def newerL=Lowest(GetValue(low,delay,delay),span);
    def olderL=Lowest(GetValue(low,span+delay+1,span+delay+1),span);
    plot PH=if enough and !IsNaN(close)and h>newerH and h>=olderH then h else Double.NaN;
    plot PL=if enough and !IsNaN(close)and l<newerL and l<=olderL then l else Double.NaN;
}

# Each side has four ordered event streams. Ordinals reproduce array push
# order, including multiple different-length confirmations on one bar.
script Extreme {
    input run=yes;input limit=1000;input cutoff=0;input total=0;
    input direction=1;
    input p1=0;input p2=0;input p3=0;input p4=0;
    input id1=0;input id2=0;input id3=0;input id4=0;
    def x=if run then fold ex=0 to limit with best=Double.POSITIVE_INFINITY
        while ex<BarNumber()and GetValue(total,ex,limit)>cutoff
        do Min(best,Min(Min(
            if GetValue(id1,ex,limit)>cutoff then GetValue(p1,ex,limit)*direction else Double.POSITIVE_INFINITY,
            if GetValue(id2,ex,limit)>cutoff then GetValue(p2,ex,limit)*direction else Double.POSITIVE_INFINITY),Min(
            if GetValue(id3,ex,limit)>cutoff then GetValue(p3,ex,limit)*direction else Double.POSITIVE_INFINITY,
            if GetValue(id4,ex,limit)>cutoff then GetValue(p4,ex,limit)*direction else Double.POSITIVE_INFINITY)))else Double.POSITIVE_INFINITY;
    plot Value=if x==Double.POSITIVE_INFINITY then Double.NaN else x*direction;
}
script BinScore {
    input run=yes;
    input row=0;
    input limit=2000;
    input bins=16;
    input bottom=0;
    input step=1;
    input timeMode=no;
    input hCut=0;
    input lCut=0;
    input cntH=0;
    input cntL=0;
    input hOld=0;
    input lOld=0;
    input hP1=0;
    input hP2=0;
    input hP3=0;
    input hP4=0;
    input hID1=0;
    input hID2=0;
    input hID3=0;
    input hID4=0;
    input hW1=0;
    input hW2=0;
    input hW3=0;
    input hW4=0;
    input lP1=0;
    input lP2=0;
    input lP3=0;
    input lP4=0;
    input lID1=0;
    input lID2=0;
    input lID3=0;
    input lID4=0;
    input lW1=0;
    input lW2=0;
    input lW3=0;
    input lW4=0;
    def safeH1=if IsNaN(hP1)then 0 else hP1;
    def safeH2=if IsNaN(hP2)then 0 else hP2;
    def safeH3=if IsNaN(hP3)then 0 else hP3;
    def safeH4=if IsNaN(hP4)then 0 else hP4;
    def safeL1=if IsNaN(lP1)then 0 else lP1;
    def safeL2=if IsNaN(lP2)then 0 else lP2;
    def safeL3=if IsNaN(lP3)then 0 else lP3;
    def safeL4=if IsNaN(lP4)then 0 else lP4;
    plot Score=if run and row<bins then fold rs=0 to limit with acc=0
        while rs<BarNumber()and(GetValue(cntH,rs,limit)>hCut or GetValue(cntL,rs,limit)>lCut)
        do acc+(if GetValue(hID1,rs,limit)>hCut
            and Min(bins - 1,Max(0,Floor((GetValue(safeH1,rs,limit)- bottom)/step)))==row
            then(if timeMode then 1+GetValue(hW1,rs,limit)- hOld else GetValue(hW1,rs,limit))else 0)
+(if GetValue(hID2,rs,limit)>hCut
            and Min(bins - 1,Max(0,Floor((GetValue(safeH2,rs,limit)- bottom)/step)))==row
            then(if timeMode then 1+GetValue(hW2,rs,limit)- hOld else GetValue(hW2,rs,limit))else 0)
+(if GetValue(hID3,rs,limit)>hCut
            and Min(bins - 1,Max(0,Floor((GetValue(safeH3,rs,limit)- bottom)/step)))==row
            then(if timeMode then 1+GetValue(hW3,rs,limit)- hOld else GetValue(hW3,rs,limit))else 0)
+(if GetValue(hID4,rs,limit)>hCut
            and Min(bins - 1,Max(0,Floor((GetValue(safeH4,rs,limit)- bottom)/step)))==row
            then(if timeMode then 1+GetValue(hW4,rs,limit)- hOld else GetValue(hW4,rs,limit))else 0)
+(if GetValue(lID1,rs,limit)>lCut
            and Min(bins - 1,Max(0,Floor((GetValue(safeL1,rs,limit)- bottom)/step)))==row
            then(if timeMode then 1+GetValue(lW1,rs,limit)- lOld else GetValue(lW1,rs,limit))else 0)
+(if GetValue(lID2,rs,limit)>lCut
            and Min(bins - 1,Max(0,Floor((GetValue(safeL2,rs,limit)- bottom)/step)))==row
            then(if timeMode then 1+GetValue(lW2,rs,limit)- lOld else GetValue(lW2,rs,limit))else 0)
+(if GetValue(lID3,rs,limit)>lCut
            and Min(bins - 1,Max(0,Floor((GetValue(safeL3,rs,limit)- bottom)/step)))==row
            then(if timeMode then 1+GetValue(lW3,rs,limit)- lOld else GetValue(lW3,rs,limit))else 0)
+(if GetValue(lID4,rs,limit)>lCut
            and Min(bins - 1,Max(0,Floor((GetValue(safeL4,rs,limit)- bottom)/step)))==row
            then(if timeMode then 1+GetValue(lW4,rs,limit)- lOld else GetValue(lW4,rs,limit))else 0)else 0;
}
script BounceAt {
    input level=0;
    input averageRange=1;
    input nextClose=close;
    def span=high - low;
    def bodyTop=Max(open,close);
    def bodyBottom=Min(open,close);
    def upperWick=high - bodyTop;
    def lowerWick=bodyBottom - low;
    def pct=if span>0 then(level - low)/span else -1;
    def upperPct=if upperWick>0 then(level - bodyTop)/upperWick else -1;
    def lowerPct=if lowerWick>0 then(level - low)/lowerWick else -1;
    def inBar=span>0 and pct>=0 and pct<=1;
    def topBounce=(upperPct>=0.5 and upperPct<=1)
        or(span>0 and upperWick/span<=0.25 and level<high and level>bodyTop)
        or(span<=averageRange*2 and level<=high and level>=bodyTop);
    def bottomBounce=(lowerPct>=0 and lowerPct<=0.5)
        or(span>0 and lowerWick/span<=0.25 and level>low and level<bodyBottom)
        or(span<=averageRange*2 and level<=bodyBottom and level>=low);
    def bear=inBar and(topBounce or(close>open and pct>=0.7))and open<level and nextClose<level;
    def bull=inBar and(bottomBounce or(close<=open and pct<=0.3))and open>level and nextClose>level;
    plot Direction=if bear then -1 else if bull then 1 else 0;
}

def vMode=weighting==weighting.Volume;
def bn=BarNumber();
def realBar=!IsNaN(close);
def onLast=realBar and IsNaN(close[-1]);
def last=HighestAll(if onLast then bn else 0);
def delay=if confirmOnClose then 1 else 0;
def snapshotBar=last - delay;
def needHistory=showPivotAverage and !calculateOnLastBarOnly;
def calculate=realBar and(onLast or(needHistory and(maHistoryBars==0 or bn>last - maHistoryBars - maSmoothing)));
def rangeTotal=TotalSum(if realBar then high - low else 0);
def barTotal=TotalSum(if realBar then 1 else 0);
def meanCandleRange=if GetValue(rangeTotal,delay,1)>0 then GetValue(rangeTotal,delay,1)/Max(1,GetValue(barTotal,delay,1))else 10;
def ph1=if includeLength1 then Pivot(span=length1,delay=delay).PH else na;
def pl1=if includeLength1 then Pivot(span=length1,delay=delay).PL else na;
def eh1=!IsNaN(ph1);
def el1=!IsNaN(pl1);
def origin1=bn - length1 - delay;
def pivotVol1=GetValue(volume,length1+delay,length1+1);
def pw1=if weighting==weighting.Linear then 1 else if weighting==weighting.Time then origin1 else if IsNaN(pivotVol1)then 0 else Max(0,pivotVol1);
def ph2=if includeLength2 then Pivot(span=length2,delay=delay).PH else na;
def pl2=if includeLength2 then Pivot(span=length2,delay=delay).PL else na;
def eh2=!IsNaN(ph2);
def el2=!IsNaN(pl2);
def origin2=bn - length2 - delay;
def pivotVol2=GetValue(volume,length2+delay,length2+1);
def pw2=if weighting==weighting.Linear then 1 else if weighting==weighting.Time then origin2 else if IsNaN(pivotVol2)then 0 else Max(0,pivotVol2);
def ph3=if includeLength3 then Pivot(span=length3,delay=delay).PH else na;
def pl3=if includeLength3 then Pivot(span=length3,delay=delay).PL else na;
def eh3=!IsNaN(ph3);
def el3=!IsNaN(pl3);
def origin3=bn - length3 - delay;
def pivotVol3=GetValue(volume,length3+delay,length3+1);
def pw3=if weighting==weighting.Linear then 1 else if weighting==weighting.Time then origin3 else if IsNaN(pivotVol3)then 0 else Max(0,pivotVol3);
def ph4=if includeLength4 then Pivot(span=length4,delay=delay).PH else na;
def pl4=if includeLength4 then Pivot(span=length4,delay=delay).PL else na;
def eh4=!IsNaN(ph4);
def el4=!IsNaN(pl4);
def origin4=bn - length4 - delay;
def pivotVol4=GetValue(volume,length4+delay,length4+1);
def pw4=if weighting==weighting.Linear then 1 else if weighting==weighting.Time then origin4 else if IsNaN(pivotVol4)then 0 else Max(0,pivotVol4);
def hNew=eh1+eh2+eh3+eh4;
def cntH=CompoundValue(1,cntH[1]+hNew,hNew);
def hSize=CompoundValue(1,if hSize[1]+hNew>numberOfPivots then hSize[1]+hNew - 1 else hSize[1]+hNew,hNew);
def hCut=cntH - hSize;
def hID1=if eh1 then cntH - eh2 - eh3 - eh4 else 0;
def hID2=if eh2 then cntH - eh3 - eh4 else 0;
def hID3=if eh3 then cntH - eh4 else 0;
def hID4=if eh4 then cntH else 0;
def lNew=el1+el2+el3+el4;
def cntL=CompoundValue(1,cntL[1]+lNew,lNew);
def lSize=CompoundValue(1,if lSize[1]+lNew>numberOfPivots then lSize[1]+lNew - 1 else lSize[1]+lNew,lNew);
def lCut=cntL - lSize;
def lID1=if el1 then cntL - el2 - el3 - el4 else 0;
def lID2=if el2 then cntL - el3 - el4 else 0;
def lID3=if el3 then cntL - el4 else 0;
def lID4=if el4 then cntL else 0;
def hMin=Extreme(calculate and includePivotHigh,searchBars,hCut,cntH,1,ph1,ph2,ph3,ph4,hID1,hID2,hID3,hID4);
def hMax=Extreme(calculate and includePivotHigh,searchBars,hCut,cntH,-1,ph1,ph2,ph3,ph4,hID1,hID2,hID3,hID4);
def hOld=Extreme(calculate and includePivotHigh,searchBars,hCut,cntH,1,origin1,origin2,origin3,origin4,hID1,hID2,hID3,hID4);
def lMin=Extreme(calculate and includePivotLow,searchBars,lCut,cntL,1,pl1,pl2,pl3,pl4,lID1,lID2,lID3,lID4);
def lMax=Extreme(calculate and includePivotLow,searchBars,lCut,cntL,-1,pl1,pl2,pl3,pl4,lID1,lID2,lID3,lID4);
def lOld=Extreme(calculate and includePivotLow,searchBars,lCut,cntL,1,origin1,origin2,origin3,origin4,lID1,lID2,lID3,lID4);
def selectedMin=if IsNaN(hMin)then lMin else if IsNaN(lMin)then hMin else Min(hMin,lMin);
def selectedMax=if IsNaN(hMax)then lMax else if IsNaN(lMax)then hMax else Max(hMax,lMax);
def ok=calculate and !IsNaN(selectedMin)and !IsNaN(selectedMax);
def safeTick=if TickSize()>0 then TickSize()else 0.01;
def loEdge=if ok then selectedMin -(if selectedMax==selectedMin then safeTick/2 else 0)else 0;
def hiEdge=if ok then selectedMax+(if selectedMax==selectedMin then safeTick/2 else 0)else 0;
def nb=if automaticPrecision then Min(16,Max(10,Ceil((hiEdge - loEdge)/Max(0.000000001,meanCandleRange))))else manualPrecision;
def stepSize=if ok then(hiEdge - loEdge)/nb else safeTick;
def cutH=if includePivotHigh then hCut else cntH;
def cutL=if includePivotLow then lCut else cntL;

# ---------- Raw histogram (one shared event engine per row) ----------
def r00=BinScore(ok,0,searchBars,nb,loEdge,stepSize,weighting==weighting.Time,cutH,cutL,cntH,cntL,hOld,lOld,ph1,ph2,ph3,ph4,hID1,hID2,hID3,hID4,pw1,pw2,pw3,pw4,pl1,pl2,pl3,pl4,lID1,lID2,lID3,lID4,pw1,pw2,pw3,pw4);
def r01=BinScore(ok,1,searchBars,nb,loEdge,stepSize,weighting==weighting.Time,cutH,cutL,cntH,cntL,hOld,lOld,ph1,ph2,ph3,ph4,hID1,hID2,hID3,hID4,pw1,pw2,pw3,pw4,pl1,pl2,pl3,pl4,lID1,lID2,lID3,lID4,pw1,pw2,pw3,pw4);
def r02=BinScore(ok,2,searchBars,nb,loEdge,stepSize,weighting==weighting.Time,cutH,cutL,cntH,cntL,hOld,lOld,ph1,ph2,ph3,ph4,hID1,hID2,hID3,hID4,pw1,pw2,pw3,pw4,pl1,pl2,pl3,pl4,lID1,lID2,lID3,lID4,pw1,pw2,pw3,pw4);
def r03=BinScore(ok,3,searchBars,nb,loEdge,stepSize,weighting==weighting.Time,cutH,cutL,cntH,cntL,hOld,lOld,ph1,ph2,ph3,ph4,hID1,hID2,hID3,hID4,pw1,pw2,pw3,pw4,pl1,pl2,pl3,pl4,lID1,lID2,lID3,lID4,pw1,pw2,pw3,pw4);
def r04=BinScore(ok,4,searchBars,nb,loEdge,stepSize,weighting==weighting.Time,cutH,cutL,cntH,cntL,hOld,lOld,ph1,ph2,ph3,ph4,hID1,hID2,hID3,hID4,pw1,pw2,pw3,pw4,pl1,pl2,pl3,pl4,lID1,lID2,lID3,lID4,pw1,pw2,pw3,pw4);
def r05=BinScore(ok,5,searchBars,nb,loEdge,stepSize,weighting==weighting.Time,cutH,cutL,cntH,cntL,hOld,lOld,ph1,ph2,ph3,ph4,hID1,hID2,hID3,hID4,pw1,pw2,pw3,pw4,pl1,pl2,pl3,pl4,lID1,lID2,lID3,lID4,pw1,pw2,pw3,pw4);
def r06=BinScore(ok,6,searchBars,nb,loEdge,stepSize,weighting==weighting.Time,cutH,cutL,cntH,cntL,hOld,lOld,ph1,ph2,ph3,ph4,hID1,hID2,hID3,hID4,pw1,pw2,pw3,pw4,pl1,pl2,pl3,pl4,lID1,lID2,lID3,lID4,pw1,pw2,pw3,pw4);
def r07=BinScore(ok,7,searchBars,nb,loEdge,stepSize,weighting==weighting.Time,cutH,cutL,cntH,cntL,hOld,lOld,ph1,ph2,ph3,ph4,hID1,hID2,hID3,hID4,pw1,pw2,pw3,pw4,pl1,pl2,pl3,pl4,lID1,lID2,lID3,lID4,pw1,pw2,pw3,pw4);
def r08=BinScore(ok,8,searchBars,nb,loEdge,stepSize,weighting==weighting.Time,cutH,cutL,cntH,cntL,hOld,lOld,ph1,ph2,ph3,ph4,hID1,hID2,hID3,hID4,pw1,pw2,pw3,pw4,pl1,pl2,pl3,pl4,lID1,lID2,lID3,lID4,pw1,pw2,pw3,pw4);
def r09=BinScore(ok,9,searchBars,nb,loEdge,stepSize,weighting==weighting.Time,cutH,cutL,cntH,cntL,hOld,lOld,ph1,ph2,ph3,ph4,hID1,hID2,hID3,hID4,pw1,pw2,pw3,pw4,pl1,pl2,pl3,pl4,lID1,lID2,lID3,lID4,pw1,pw2,pw3,pw4);
def r10=BinScore(ok,10,searchBars,nb,loEdge,stepSize,weighting==weighting.Time,cutH,cutL,cntH,cntL,hOld,lOld,ph1,ph2,ph3,ph4,hID1,hID2,hID3,hID4,pw1,pw2,pw3,pw4,pl1,pl2,pl3,pl4,lID1,lID2,lID3,lID4,pw1,pw2,pw3,pw4);
def r11=BinScore(ok,11,searchBars,nb,loEdge,stepSize,weighting==weighting.Time,cutH,cutL,cntH,cntL,hOld,lOld,ph1,ph2,ph3,ph4,hID1,hID2,hID3,hID4,pw1,pw2,pw3,pw4,pl1,pl2,pl3,pl4,lID1,lID2,lID3,lID4,pw1,pw2,pw3,pw4);
def r12=BinScore(ok,12,searchBars,nb,loEdge,stepSize,weighting==weighting.Time,cutH,cutL,cntH,cntL,hOld,lOld,ph1,ph2,ph3,ph4,hID1,hID2,hID3,hID4,pw1,pw2,pw3,pw4,pl1,pl2,pl3,pl4,lID1,lID2,lID3,lID4,pw1,pw2,pw3,pw4);
def r13=BinScore(ok,13,searchBars,nb,loEdge,stepSize,weighting==weighting.Time,cutH,cutL,cntH,cntL,hOld,lOld,ph1,ph2,ph3,ph4,hID1,hID2,hID3,hID4,pw1,pw2,pw3,pw4,pl1,pl2,pl3,pl4,lID1,lID2,lID3,lID4,pw1,pw2,pw3,pw4);
def r14=BinScore(ok,14,searchBars,nb,loEdge,stepSize,weighting==weighting.Time,cutH,cutL,cntH,cntL,hOld,lOld,ph1,ph2,ph3,ph4,hID1,hID2,hID3,hID4,pw1,pw2,pw3,pw4,pl1,pl2,pl3,pl4,lID1,lID2,lID3,lID4,pw1,pw2,pw3,pw4);
def r15=BinScore(ok,15,searchBars,nb,loEdge,stepSize,weighting==weighting.Time,cutH,cutL,cntH,cntL,hOld,lOld,ph1,ph2,ph3,ph4,hID1,hID2,hID3,hID4,pw1,pw2,pw3,pw4,pl1,pl2,pl3,pl4,lID1,lID2,lID3,lID4,pw1,pw2,pw3,pw4);
# ---------- Full normalized sinc convolution; negative values clamp to 0 ----------
def k00=1;
def k01=Sinc(distance=1,amount=filtering);
def k02=Sinc(distance=2,amount=filtering);
def k03=Sinc(distance=3,amount=filtering);
def k04=Sinc(distance=4,amount=filtering);
def k05=Sinc(distance=5,amount=filtering);
def k06=Sinc(distance=6,amount=filtering);
def k07=Sinc(distance=7,amount=filtering);
def k08=Sinc(distance=8,amount=filtering);
def k09=Sinc(distance=9,amount=filtering);
def k10=Sinc(distance=10,amount=filtering);
def k11=Sinc(distance=11,amount=filtering);
def k12=Sinc(distance=12,amount=filtering);
def k13=Sinc(distance=13,amount=filtering);
def k14=Sinc(distance=14,amount=filtering);
def k15=Sinc(distance=15,amount=filtering);
# Inline the kernel: the fold-local counter cannot be passed to SincWeight here.
def d00=fold kd=0 to 16 with ksum=0
    do ksum+(if kd>=nb then 0
        else if kd==0 then 1
        else if filtering<=0 then 0
        else Sin(Double.Pi*kd/(filtering+1))
/(Double.Pi*kd/(filtering+1)));
def d01=d00+k01 - Sinc(distance=nb - 1,amount=filtering);
def d02=d01+k02 - Sinc(distance=nb - 2,amount=filtering);
def d03=d02+k03 - Sinc(distance=nb - 3,amount=filtering);
def d04=d03+k04 - Sinc(distance=nb - 4,amount=filtering);
def d05=d04+k05 - Sinc(distance=nb - 5,amount=filtering);
def d06=d05+k06 - Sinc(distance=nb - 6,amount=filtering);
def d07=d06+k07 - Sinc(distance=nb - 7,amount=filtering);
def d08=d07+k08 - Sinc(distance=nb - 8,amount=filtering);
def d09=d08+k09 - Sinc(distance=nb - 9,amount=filtering);
def d10=d09+k10 - Sinc(distance=nb - 10,amount=filtering);
def d11=d10+k11 - Sinc(distance=nb - 11,amount=filtering);
def d12=d11+k12 - Sinc(distance=nb - 12,amount=filtering);
def d13=d12+k13 - Sinc(distance=nb - 13,amount=filtering);
def d14=d13+k14 - Sinc(distance=nb - 14,amount=filtering);
def d15=d14+k15 - Sinc(distance=nb - 15,amount=filtering);
def f00=if ok and 0<nb and AbsValue(d00)>0.000000001 then Max(0,(
    r00+r01*k01+r02*k02+r03*k03+r04*k04+r05*k05+r06*k06+r07*k07+r08*k08+r09*k09+r10*k10+r11*k11+r12*k12+r13*k13+r14*k14+r15*k15
)/d00)else 0;
def f01=if ok and 1<nb and AbsValue(d01)>0.000000001 then Max(0,(
    r01+(r00+r02)*k01+r03*k02+r04*k03+r05*k04+r06*k05+r07*k06+r08*k07+r09*k08+r10*k09+r11*k10+r12*k11+r13*k12+r14*k13+r15*k14
)/d01)else 0;
def f02=if ok and 2<nb and AbsValue(d02)>0.000000001 then Max(0,(
    r02+(r01+r03)*k01+(r00+r04)*k02+r05*k03+r06*k04+r07*k05+r08*k06+r09*k07+r10*k08+r11*k09+r12*k10+r13*k11+r14*k12+r15*k13
)/d02)else 0;
def f03=if ok and 3<nb and AbsValue(d03)>0.000000001 then Max(0,(
    r03+(r02+r04)*k01+(r01+r05)*k02+(r00+r06)*k03+r07*k04+r08*k05+r09*k06+r10*k07+r11*k08+r12*k09+r13*k10+r14*k11+r15*k12
)/d03)else 0;
def f04=if ok and 4<nb and AbsValue(d04)>0.000000001 then Max(0,(
    r04+(r03+r05)*k01+(r02+r06)*k02+(r01+r07)*k03+(r00+r08)*k04+r09*k05+r10*k06+r11*k07+r12*k08+r13*k09+r14*k10+r15*k11
)/d04)else 0;
def f05=if ok and 5<nb and AbsValue(d05)>0.000000001 then Max(0,(
    r05+(r04+r06)*k01+(r03+r07)*k02+(r02+r08)*k03+(r01+r09)*k04+(r00+r10)*k05+r11*k06+r12*k07+r13*k08+r14*k09+r15*k10
)/d05)else 0;
def f06=if ok and 6<nb and AbsValue(d06)>0.000000001 then Max(0,(
    r06+(r05+r07)*k01+(r04+r08)*k02+(r03+r09)*k03+(r02+r10)*k04+(r01+r11)*k05+(r00+r12)*k06+r13*k07+r14*k08+r15*k09
)/d06)else 0;
def f07=if ok and 7<nb and AbsValue(d07)>0.000000001 then Max(0,(
    r07+(r06+r08)*k01+(r05+r09)*k02+(r04+r10)*k03+(r03+r11)*k04+(r02+r12)*k05+(r01+r13)*k06+(r00+r14)*k07+r15*k08
)/d07)else 0;
def f08=if ok and 8<nb and AbsValue(d08)>0.000000001 then Max(0,(
    r08+(r07+r09)*k01+(r06+r10)*k02+(r05+r11)*k03+(r04+r12)*k04+(r03+r13)*k05+(r02+r14)*k06+(r01+r15)*k07+r00*k08
)/d08)else 0;
def f09=if ok and 9<nb and AbsValue(d09)>0.000000001 then Max(0,(
    r09+(r08+r10)*k01+(r07+r11)*k02+(r06+r12)*k03+(r05+r13)*k04+(r04+r14)*k05+(r03+r15)*k06+r02*k07+r01*k08+r00*k09
)/d09)else 0;
def f10=if ok and 10<nb and AbsValue(d10)>0.000000001 then Max(0,(
    r10+(r09+r11)*k01+(r08+r12)*k02+(r07+r13)*k03+(r06+r14)*k04+(r05+r15)*k05+r04*k06+r03*k07+r02*k08+r01*k09+r00*k10
)/d10)else 0;
def f11=if ok and 11<nb and AbsValue(d11)>0.000000001 then Max(0,(
    r11+(r10+r12)*k01+(r09+r13)*k02+(r08+r14)*k03+(r07+r15)*k04+r06*k05+r05*k06+r04*k07+r03*k08+r02*k09+r01*k10+r00*k11
)/d11)else 0;
def f12=if ok and 12<nb and AbsValue(d12)>0.000000001 then Max(0,(
    r12+(r11+r13)*k01+(r10+r14)*k02+(r09+r15)*k03+r08*k04+r07*k05+r06*k06+r05*k07+r04*k08+r03*k09+r02*k10+r01*k11+r00*k12
)/d12)else 0;
def f13=if ok and 13<nb and AbsValue(d13)>0.000000001 then Max(0,(
    r13+(r12+r14)*k01+(r11+r15)*k02+r10*k03+r09*k04+r08*k05+r07*k06+r06*k07+r05*k08+r04*k09+r03*k10+r02*k11+r01*k12+r00*k13
)/d13)else 0;
def f14=if ok and 14<nb and AbsValue(d14)>0.000000001 then Max(0,(
    r14+(r13+r15)*k01+r12*k02+r11*k03+r10*k04+r09*k05+r08*k06+r07*k07+r06*k08+r05*k09+r04*k10+r03*k11+r02*k12+r01*k13+r00*k14
)/d14)else 0;
def f15=if ok and 15<nb and AbsValue(d15)>0.000000001 then Max(0,(
    r15+r14*k01+r13*k02+r12*k03+r11*k04+r10*k05+r09*k06+r08*k07+r07*k08+r06*k09+r05*k10+r04*k11+r03*k12+r02*k13+r01*k14+r00*k15
)/d15)else 0;
# ---------- Historical filtered-bin average ----------
def scoreTotal=f00+f01+f02+f03+f04+f05+f06+f07+f08+f09+f10+f11+f12+f13+f14+f15;
def scoreMoment=f00*0.5+f01*1.5+f02*2.5+f03*3.5+f04*4.5+f05*5.5+f06*6.5+f07*7.5+f08*8.5+f09*9.5+f10*10.5+f11*11.5+f12*12.5+f13*13.5+f14*14.5+f15*15.5;
def rawAverage=if ok and scoreTotal>0 then loEdge+stepSize*scoreMoment/scoreTotal else na;
def averageSeries=Average(rawAverage,maSmoothing+1);
plot PivotAverage=if needHistory and realBar and(maHistoryBars==0 or bn>last - maHistoryBars)then averageSeries else na;
PivotAverage.SetDefaultColor(GlobalColor("Pivot average"));
PivotAverage.SetLineWeight(2);
PivotAverage.HideBubble();
PivotAverage.HideTitle();
def glowMid=if showAverageGlow then PivotAverage else na;
AddCloud(glowMid+meanCandleRange/6,glowMid,GlobalColor("Glow inner"),GlobalColor("Glow inner"));
AddCloud(glowMid,glowMid - meanCandleRange/6,GlobalColor("Glow inner"),GlobalColor("Glow inner"));
AddCloud(glowMid+meanCandleRange/3,glowMid+meanCandleRange/6,GlobalColor("Glow middle"),GlobalColor("Glow middle"));
AddCloud(glowMid - meanCandleRange/6,glowMid - meanCandleRange/3,GlobalColor("Glow middle"),GlobalColor("Glow middle"));
AddCloud(glowMid+meanCandleRange/2,glowMid+meanCandleRange/3,GlobalColor("Glow outer"),GlobalColor("Glow outer"));
AddCloud(glowMid - meanCandleRange/3,glowMid - meanCandleRange/2,GlobalColor("Glow outer"),GlobalColor("Glow outer"));

# ---------- Freeze the latest profile across the chart ----------
def pLo=HighestAll(if onLast then loEdge else na);
def dz=HighestAll(if onLast then stepSize else na);
def nbLast=HighestAll(if onLast then nb else na);
def hasProfile=HighestAll(if onLast then ok else 0);
def lastC=HighestAll(if onLast then GetValue(close,delay,1)else na);
def lastRange=HighestAll(if onLast then meanCandleRange else na);
def edge=last+distributionGap+distributionScale;
def leftAllowed=extendLeftBars==0 or bn>=snapshotBar - extendLeftBars+1;
def srArea=leftAllowed and bn<=edge;
def bounceArea=realBar and bn<=snapshotBar and bn>snapshotBar - bounceLookback;
def nextCloseForBounce=if bn<snapshotBar then close[-1] else close;
def s00=HighestAll(if onLast then f00 else na);
def s01=HighestAll(if onLast then f01 else na);
def s02=HighestAll(if onLast then f02 else na);
def s03=HighestAll(if onLast then f03 else na);
def s04=HighestAll(if onLast then f04 else na);
def s05=HighestAll(if onLast then f05 else na);
def s06=HighestAll(if onLast then f06 else na);
def s07=HighestAll(if onLast then f07 else na);
def s08=HighestAll(if onLast then f08 else na);
def s09=HighestAll(if onLast then f09 else na);
def s10=HighestAll(if onLast then f10 else na);
def s11=HighestAll(if onLast then f11 else na);
def s12=HighestAll(if onLast then f12 else na);
def s13=HighestAll(if onLast then f13 else na);
def s14=HighestAll(if onLast then f14 else na);
def s15=HighestAll(if onLast then f15 else na);
def maxScore=Max(Max(Max(Max(s00,s01),Max(s02,s03)),Max(Max(s04,s05),Max(s06,s07))),Max(Max(Max(s08,s09),Max(s10,s11)),Max(Max(s12,s13),Max(s14,s15))));
def minPos=Min(Min(Min(Min((if s00>0 then s00 else Double.POSITIVE_INFINITY),(if s01>0 then s01 else Double.POSITIVE_INFINITY)),Min((if s02>0 then s02 else Double.POSITIVE_INFINITY),(if s03>0 then s03 else Double.POSITIVE_INFINITY))),Min(Min((if s04>0 then s04 else Double.POSITIVE_INFINITY),(if s05>0 then s05 else Double.POSITIVE_INFINITY)),Min((if s06>0 then s06 else Double.POSITIVE_INFINITY),(if s07>0 then s07 else Double.POSITIVE_INFINITY)))),Min(Min(Min((if s08>0 then s08 else Double.POSITIVE_INFINITY),(if s09>0 then s09 else Double.POSITIVE_INFINITY)),Min((if s10>0 then s10 else Double.POSITIVE_INFINITY),(if s11>0 then s11 else Double.POSITIVE_INFINITY))),Min(Min((if s12>0 then s12 else Double.POSITIVE_INFINITY),(if s13>0 then s13 else Double.POSITIVE_INFINITY)),Min((if s14>0 then s14 else Double.POSITIVE_INFINITY),(if s15>0 then s15 else Double.POSITIVE_INFINITY)))));
def floorScore=if minPos==Double.POSITIVE_INFINITY then 0 else minPos;
def spread=maxScore - floorScore;
def q00=if 0>=nbLast then 0 else if spread>0.000000001 then(s00 - floorScore)/spread*(distributionScale - 1)+1 else if s00>0 then distributionScale else 0;
def w00=if q00>=0 then Floor(q00)else Ceil(q00);
def q01=if 1>=nbLast then 0 else if spread>0.000000001 then(s01 - floorScore)/spread*(distributionScale - 1)+1 else if s01>0 then distributionScale else 0;
def w01=if q01>=0 then Floor(q01)else Ceil(q01);
def q02=if 2>=nbLast then 0 else if spread>0.000000001 then(s02 - floorScore)/spread*(distributionScale - 1)+1 else if s02>0 then distributionScale else 0;
def w02=if q02>=0 then Floor(q02)else Ceil(q02);
def q03=if 3>=nbLast then 0 else if spread>0.000000001 then(s03 - floorScore)/spread*(distributionScale - 1)+1 else if s03>0 then distributionScale else 0;
def w03=if q03>=0 then Floor(q03)else Ceil(q03);
def q04=if 4>=nbLast then 0 else if spread>0.000000001 then(s04 - floorScore)/spread*(distributionScale - 1)+1 else if s04>0 then distributionScale else 0;
def w04=if q04>=0 then Floor(q04)else Ceil(q04);
def q05=if 5>=nbLast then 0 else if spread>0.000000001 then(s05 - floorScore)/spread*(distributionScale - 1)+1 else if s05>0 then distributionScale else 0;
def w05=if q05>=0 then Floor(q05)else Ceil(q05);
def q06=if 6>=nbLast then 0 else if spread>0.000000001 then(s06 - floorScore)/spread*(distributionScale - 1)+1 else if s06>0 then distributionScale else 0;
def w06=if q06>=0 then Floor(q06)else Ceil(q06);
def q07=if 7>=nbLast then 0 else if spread>0.000000001 then(s07 - floorScore)/spread*(distributionScale - 1)+1 else if s07>0 then distributionScale else 0;
def w07=if q07>=0 then Floor(q07)else Ceil(q07);
def q08=if 8>=nbLast then 0 else if spread>0.000000001 then(s08 - floorScore)/spread*(distributionScale - 1)+1 else if s08>0 then distributionScale else 0;
def w08=if q08>=0 then Floor(q08)else Ceil(q08);
def q09=if 9>=nbLast then 0 else if spread>0.000000001 then(s09 - floorScore)/spread*(distributionScale - 1)+1 else if s09>0 then distributionScale else 0;
def w09=if q09>=0 then Floor(q09)else Ceil(q09);
def q10=if 10>=nbLast then 0 else if spread>0.000000001 then(s10 - floorScore)/spread*(distributionScale - 1)+1 else if s10>0 then distributionScale else 0;
def w10=if q10>=0 then Floor(q10)else Ceil(q10);
def q11=if 11>=nbLast then 0 else if spread>0.000000001 then(s11 - floorScore)/spread*(distributionScale - 1)+1 else if s11>0 then distributionScale else 0;
def w11=if q11>=0 then Floor(q11)else Ceil(q11);
def q12=if 12>=nbLast then 0 else if spread>0.000000001 then(s12 - floorScore)/spread*(distributionScale - 1)+1 else if s12>0 then distributionScale else 0;
def w12=if q12>=0 then Floor(q12)else Ceil(q12);
def q13=if 13>=nbLast then 0 else if spread>0.000000001 then(s13 - floorScore)/spread*(distributionScale - 1)+1 else if s13>0 then distributionScale else 0;
def w13=if q13>=0 then Floor(q13)else Ceil(q13);
def q14=if 14>=nbLast then 0 else if spread>0.000000001 then(s14 - floorScore)/spread*(distributionScale - 1)+1 else if s14>0 then distributionScale else 0;
def w14=if q14>=0 then Floor(q14)else Ceil(q14);
def q15=if 15>=nbLast then 0 else if spread>0.000000001 then(s15 - floorScore)/spread*(distributionScale - 1)+1 else if s15>0 then distributionScale else 0;
def w15=if q15>=0 then Floor(q15)else Ceil(q15);
# Plateau centers are retained, including half-bin centers.
def end15=15;
def fall15=w15>0;
def end14=if w14==w15 then end15 else 14;
def fall14=if w14==w15 then fall15 else w14>w15;
def end13=if w13==w14 then end14 else 13;
def fall13=if w13==w14 then fall14 else w13>w14;
def end12=if w12==w13 then end13 else 12;
def fall12=if w12==w13 then fall13 else w12>w13;
def end11=if w11==w12 then end12 else 11;
def fall11=if w11==w12 then fall12 else w11>w12;
def end10=if w10==w11 then end11 else 10;
def fall10=if w10==w11 then fall11 else w10>w11;
def end09=if w09==w10 then end10 else 9;
def fall09=if w09==w10 then fall10 else w09>w10;
def end08=if w08==w09 then end09 else 8;
def fall08=if w08==w09 then fall09 else w08>w09;
def end07=if w07==w08 then end08 else 7;
def fall07=if w07==w08 then fall08 else w07>w08;
def end06=if w06==w07 then end07 else 6;
def fall06=if w06==w07 then fall07 else w06>w07;
def end05=if w05==w06 then end06 else 5;
def fall05=if w05==w06 then fall06 else w05>w06;
def end04=if w04==w05 then end05 else 4;
def fall04=if w04==w05 then fall05 else w04>w05;
def end03=if w03==w04 then end04 else 3;
def fall03=if w03==w04 then fall04 else w03>w04;
def end02=if w02==w03 then end03 else 2;
def fall02=if w02==w03 then fall03 else w02>w03;
def end01=if w01==w02 then end02 else 1;
def fall01=if w01==w02 then fall02 else w01>w02;
def end00=if w00==w01 then end01 else 0;
def fall00=if w00==w01 then fall01 else w00>w01;
def pk00=hasProfile and maxScore>0 and 0<nbLast and w00>0 and fall00;
def lv00=pLo+dz*(0+end00+1)/2;
def pk01=hasProfile and maxScore>0 and 1<nbLast and w01>w00 and fall01;
def lv01=pLo+dz*(1+end01+1)/2;
def pk02=hasProfile and maxScore>0 and 2<nbLast and w02>w01 and fall02;
def lv02=pLo+dz*(2+end02+1)/2;
def pk03=hasProfile and maxScore>0 and 3<nbLast and w03>w02 and fall03;
def lv03=pLo+dz*(3+end03+1)/2;
def pk04=hasProfile and maxScore>0 and 4<nbLast and w04>w03 and fall04;
def lv04=pLo+dz*(4+end04+1)/2;
def pk05=hasProfile and maxScore>0 and 5<nbLast and w05>w04 and fall05;
def lv05=pLo+dz*(5+end05+1)/2;
def pk06=hasProfile and maxScore>0 and 6<nbLast and w06>w05 and fall06;
def lv06=pLo+dz*(6+end06+1)/2;
def pk07=hasProfile and maxScore>0 and 7<nbLast and w07>w06 and fall07;
def lv07=pLo+dz*(7+end07+1)/2;
def pk08=hasProfile and maxScore>0 and 8<nbLast and w08>w07 and fall08;
def lv08=pLo+dz*(8+end08+1)/2;
def pk09=hasProfile and maxScore>0 and 9<nbLast and w09>w08 and fall09;
def lv09=pLo+dz*(9+end09+1)/2;
def pk10=hasProfile and maxScore>0 and 10<nbLast and w10>w09 and fall10;
def lv10=pLo+dz*(10+end10+1)/2;
def pk11=hasProfile and maxScore>0 and 11<nbLast and w11>w10 and fall11;
def lv11=pLo+dz*(11+end11+1)/2;
def pk12=hasProfile and maxScore>0 and 12<nbLast and w12>w11 and fall12;
def lv12=pLo+dz*(12+end12+1)/2;
def pk13=hasProfile and maxScore>0 and 13<nbLast and w13>w12 and fall13;
def lv13=pLo+dz*(13+end13+1)/2;
def pk14=hasProfile and maxScore>0 and 14<nbLast and w14>w13 and fall14;
def lv14=pLo+dz*(14+end14+1)/2;
def pk15=hasProfile and maxScore>0 and 15<nbLast and w15>w14 and fall15;
def lv15=pLo+dz*(15+end15+1)/2;
# Compact drawing aliases.
def drawSR=showSupportResistance and srArea;
def drawZone=drawSR and showZones;
def drawDist=showDistribution;
def drawHeat=showHeatMap and srArea;
def drawScore=showDistribution and showDistributionScores and bn==edge+scoreBubbleOffset;
def checkHits=showSupportResistance and showBounces and bounceArea;
def redDelta=highRed - lowRed;
def greenDelta=highGreen - lowGreen;
def blueDelta=highBlue - lowBlue;

# Native distribution rows; color gradient retained.

def mid00=pLo+dz*0.5;
def bot00=pLo+dz*0;
def u00=Max(0,Min(1,w00/distributionScale));
def has00=hasProfile and 0<nbLast and s00>0;
plot Dist00=if drawDist and has00 and bn>=edge-Max(1,w00)and bn<=edge then mid00 else na;
Dist00.SetPaintingStrategy(PaintingStrategy.HORIZONTAL);Dist00.SetLineWeight(distributionLineWeight);
Dist00.AssignValueColor(CreateColor(lowRed+redDelta*u00,lowGreen+greenDelta*u00,lowBlue+blueDelta*u00));
Dist00.HideBubble();Dist00.HideTitle();
def heatL00=if drawHeat and has00 and u00<0.67 then bot00+(if u00<0.33 then dz else 0)else na;
AddCloud(heatL00,2*bot00+dz-heatL00,GlobalColor("Heat 0"),GlobalColor("Heat 2"));
def heatH00=if drawHeat and has00 and u00>=0.67 then bot00 else na;
AddCloud(heatH00+dz,heatH00,GlobalColor("Heat 4"),GlobalColor("Heat 4"));
def unit00=if !vMode then 1 else if s00>=1000000000 then 1000000000 else if s00>=1000000 then 1000000 else if s00>=1000 then 1000 else 1;
AddChartBubble(drawScore and has00 and 0%scoreEveryNBins==0,mid00,
(if !vMode then ""+Ceil(s00)else ""+Round(s00/unit00,2))+(if unit00==1000000000 then "B" else if unit00==1000000 then "M" else if unit00==1000 then "K" else ""),
    CreateColor(lowRed+redDelta*u00,lowGreen+greenDelta*u00,lowBlue+blueDelta*u00),yes);

def mid01=pLo+dz*1.5;
def bot01=pLo+dz*1;
def u01=Max(0,Min(1,w01/distributionScale));
def has01=hasProfile and 1<nbLast and s01>0;
plot Dist01=if drawDist and has01 and bn>=edge-Max(1,w01)and bn<=edge then mid01 else na;
Dist01.SetPaintingStrategy(PaintingStrategy.HORIZONTAL);Dist01.SetLineWeight(distributionLineWeight);
Dist01.AssignValueColor(CreateColor(lowRed+redDelta*u01,lowGreen+greenDelta*u01,lowBlue+blueDelta*u01));
Dist01.HideBubble();Dist01.HideTitle();
def heatL01=if drawHeat and has01 and u01<0.67 then bot01+(if u01<0.33 then dz else 0)else na;
AddCloud(heatL01,2*bot01+dz-heatL01,GlobalColor("Heat 0"),GlobalColor("Heat 2"));
def heatH01=if drawHeat and has01 and u01>=0.67 then bot01 else na;
AddCloud(heatH01+dz,heatH01,GlobalColor("Heat 4"),GlobalColor("Heat 4"));
def unit01=if !vMode then 1 else if s01>=1000000000 then 1000000000 else if s01>=1000000 then 1000000 else if s01>=1000 then 1000 else 1;
AddChartBubble(drawScore and has01 and 1%scoreEveryNBins==0,mid01,
(if !vMode then ""+Ceil(s01)else ""+Round(s01/unit01,2))+(if unit01==1000000000 then "B" else if unit01==1000000 then "M" else if unit01==1000 then "K" else ""),
    CreateColor(lowRed+redDelta*u01,lowGreen+greenDelta*u01,lowBlue+blueDelta*u01),yes);

def mid02=pLo+dz*2.5;
def bot02=pLo+dz*2;
def u02=Max(0,Min(1,w02/distributionScale));
def has02=hasProfile and 2<nbLast and s02>0;
plot Dist02=if drawDist and has02 and bn>=edge-Max(1,w02)and bn<=edge then mid02 else na;
Dist02.SetPaintingStrategy(PaintingStrategy.HORIZONTAL);Dist02.SetLineWeight(distributionLineWeight);
Dist02.AssignValueColor(CreateColor(lowRed+redDelta*u02,lowGreen+greenDelta*u02,lowBlue+blueDelta*u02));
Dist02.HideBubble();Dist02.HideTitle();
def heatL02=if drawHeat and has02 and u02<0.67 then bot02+(if u02<0.33 then dz else 0)else na;
AddCloud(heatL02,2*bot02+dz-heatL02,GlobalColor("Heat 0"),GlobalColor("Heat 2"));
def heatH02=if drawHeat and has02 and u02>=0.67 then bot02 else na;
AddCloud(heatH02+dz,heatH02,GlobalColor("Heat 4"),GlobalColor("Heat 4"));
def unit02=if !vMode then 1 else if s02>=1000000000 then 1000000000 else if s02>=1000000 then 1000000 else if s02>=1000 then 1000 else 1;
AddChartBubble(drawScore and has02 and 2%scoreEveryNBins==0,mid02,
(if !vMode then ""+Ceil(s02)else ""+Round(s02/unit02,2))+(if unit02==1000000000 then "B" else if unit02==1000000 then "M" else if unit02==1000 then "K" else ""),
    CreateColor(lowRed+redDelta*u02,lowGreen+greenDelta*u02,lowBlue+blueDelta*u02),yes);

def mid03=pLo+dz*3.5;
def bot03=pLo+dz*3;
def u03=Max(0,Min(1,w03/distributionScale));
def has03=hasProfile and 3<nbLast and s03>0;
plot Dist03=if drawDist and has03 and bn>=edge-Max(1,w03)and bn<=edge then mid03 else na;
Dist03.SetPaintingStrategy(PaintingStrategy.HORIZONTAL);Dist03.SetLineWeight(distributionLineWeight);
Dist03.AssignValueColor(CreateColor(lowRed+redDelta*u03,lowGreen+greenDelta*u03,lowBlue+blueDelta*u03));
Dist03.HideBubble();Dist03.HideTitle();
def heatL03=if drawHeat and has03 and u03<0.67 then bot03+(if u03<0.33 then dz else 0)else na;
AddCloud(heatL03,2*bot03+dz-heatL03,GlobalColor("Heat 0"),GlobalColor("Heat 2"));
def heatH03=if drawHeat and has03 and u03>=0.67 then bot03 else na;
AddCloud(heatH03+dz,heatH03,GlobalColor("Heat 4"),GlobalColor("Heat 4"));
def unit03=if !vMode then 1 else if s03>=1000000000 then 1000000000 else if s03>=1000000 then 1000000 else if s03>=1000 then 1000 else 1;
AddChartBubble(drawScore and has03 and 3%scoreEveryNBins==0,mid03,
(if !vMode then ""+Ceil(s03)else ""+Round(s03/unit03,2))+(if unit03==1000000000 then "B" else if unit03==1000000 then "M" else if unit03==1000 then "K" else ""),
    CreateColor(lowRed+redDelta*u03,lowGreen+greenDelta*u03,lowBlue+blueDelta*u03),yes);

def mid04=pLo+dz*4.5;
def bot04=pLo+dz*4;
def u04=Max(0,Min(1,w04/distributionScale));
def has04=hasProfile and 4<nbLast and s04>0;
plot Dist04=if drawDist and has04 and bn>=edge-Max(1,w04)and bn<=edge then mid04 else na;
Dist04.SetPaintingStrategy(PaintingStrategy.HORIZONTAL);Dist04.SetLineWeight(distributionLineWeight);
Dist04.AssignValueColor(CreateColor(lowRed+redDelta*u04,lowGreen+greenDelta*u04,lowBlue+blueDelta*u04));
Dist04.HideBubble();Dist04.HideTitle();
def heatL04=if drawHeat and has04 and u04<0.67 then bot04+(if u04<0.33 then dz else 0)else na;
AddCloud(heatL04,2*bot04+dz-heatL04,GlobalColor("Heat 0"),GlobalColor("Heat 2"));
def heatH04=if drawHeat and has04 and u04>=0.67 then bot04 else na;
AddCloud(heatH04+dz,heatH04,GlobalColor("Heat 4"),GlobalColor("Heat 4"));
def unit04=if !vMode then 1 else if s04>=1000000000 then 1000000000 else if s04>=1000000 then 1000000 else if s04>=1000 then 1000 else 1;
AddChartBubble(drawScore and has04 and 4%scoreEveryNBins==0,mid04,
(if !vMode then ""+Ceil(s04)else ""+Round(s04/unit04,2))+(if unit04==1000000000 then "B" else if unit04==1000000 then "M" else if unit04==1000 then "K" else ""),
    CreateColor(lowRed+redDelta*u04,lowGreen+greenDelta*u04,lowBlue+blueDelta*u04),yes);

def mid05=pLo+dz*5.5;
def bot05=pLo+dz*5;
def u05=Max(0,Min(1,w05/distributionScale));
def has05=hasProfile and 5<nbLast and s05>0;
plot Dist05=if drawDist and has05 and bn>=edge-Max(1,w05)and bn<=edge then mid05 else na;
Dist05.SetPaintingStrategy(PaintingStrategy.HORIZONTAL);Dist05.SetLineWeight(distributionLineWeight);
Dist05.AssignValueColor(CreateColor(lowRed+redDelta*u05,lowGreen+greenDelta*u05,lowBlue+blueDelta*u05));
Dist05.HideBubble();Dist05.HideTitle();
def heatL05=if drawHeat and has05 and u05<0.67 then bot05+(if u05<0.33 then dz else 0)else na;
AddCloud(heatL05,2*bot05+dz-heatL05,GlobalColor("Heat 0"),GlobalColor("Heat 2"));
def heatH05=if drawHeat and has05 and u05>=0.67 then bot05 else na;
AddCloud(heatH05+dz,heatH05,GlobalColor("Heat 4"),GlobalColor("Heat 4"));
def unit05=if !vMode then 1 else if s05>=1000000000 then 1000000000 else if s05>=1000000 then 1000000 else if s05>=1000 then 1000 else 1;
AddChartBubble(drawScore and has05 and 5%scoreEveryNBins==0,mid05,
(if !vMode then ""+Ceil(s05)else ""+Round(s05/unit05,2))+(if unit05==1000000000 then "B" else if unit05==1000000 then "M" else if unit05==1000 then "K" else ""),
    CreateColor(lowRed+redDelta*u05,lowGreen+greenDelta*u05,lowBlue+blueDelta*u05),yes);

def mid06=pLo+dz*6.5;
def bot06=pLo+dz*6;
def u06=Max(0,Min(1,w06/distributionScale));
def has06=hasProfile and 6<nbLast and s06>0;
plot Dist06=if drawDist and has06 and bn>=edge-Max(1,w06)and bn<=edge then mid06 else na;
Dist06.SetPaintingStrategy(PaintingStrategy.HORIZONTAL);Dist06.SetLineWeight(distributionLineWeight);
Dist06.AssignValueColor(CreateColor(lowRed+redDelta*u06,lowGreen+greenDelta*u06,lowBlue+blueDelta*u06));
Dist06.HideBubble();Dist06.HideTitle();
def heatL06=if drawHeat and has06 and u06<0.67 then bot06+(if u06<0.33 then dz else 0)else na;
AddCloud(heatL06,2*bot06+dz-heatL06,GlobalColor("Heat 0"),GlobalColor("Heat 2"));
def heatH06=if drawHeat and has06 and u06>=0.67 then bot06 else na;
AddCloud(heatH06+dz,heatH06,GlobalColor("Heat 4"),GlobalColor("Heat 4"));
def unit06=if !vMode then 1 else if s06>=1000000000 then 1000000000 else if s06>=1000000 then 1000000 else if s06>=1000 then 1000 else 1;
AddChartBubble(drawScore and has06 and 6%scoreEveryNBins==0,mid06,
(if !vMode then ""+Ceil(s06)else ""+Round(s06/unit06,2))+(if unit06==1000000000 then "B" else if unit06==1000000 then "M" else if unit06==1000 then "K" else ""),
    CreateColor(lowRed+redDelta*u06,lowGreen+greenDelta*u06,lowBlue+blueDelta*u06),yes);

def mid07=pLo+dz*7.5;
def bot07=pLo+dz*7;
def u07=Max(0,Min(1,w07/distributionScale));
def has07=hasProfile and 7<nbLast and s07>0;
plot Dist07=if drawDist and has07 and bn>=edge-Max(1,w07)and bn<=edge then mid07 else na;
Dist07.SetPaintingStrategy(PaintingStrategy.HORIZONTAL);Dist07.SetLineWeight(distributionLineWeight);
Dist07.AssignValueColor(CreateColor(lowRed+redDelta*u07,lowGreen+greenDelta*u07,lowBlue+blueDelta*u07));
Dist07.HideBubble();Dist07.HideTitle();
def heatL07=if drawHeat and has07 and u07<0.67 then bot07+(if u07<0.33 then dz else 0)else na;
AddCloud(heatL07,2*bot07+dz-heatL07,GlobalColor("Heat 0"),GlobalColor("Heat 2"));
def heatH07=if drawHeat and has07 and u07>=0.67 then bot07 else na;
AddCloud(heatH07+dz,heatH07,GlobalColor("Heat 4"),GlobalColor("Heat 4"));
def unit07=if !vMode then 1 else if s07>=1000000000 then 1000000000 else if s07>=1000000 then 1000000 else if s07>=1000 then 1000 else 1;
AddChartBubble(drawScore and has07 and 7%scoreEveryNBins==0,mid07,
(if !vMode then ""+Ceil(s07)else ""+Round(s07/unit07,2))+(if unit07==1000000000 then "B" else if unit07==1000000 then "M" else if unit07==1000 then "K" else ""),
    CreateColor(lowRed+redDelta*u07,lowGreen+greenDelta*u07,lowBlue+blueDelta*u07),yes);

def mid08=pLo+dz*8.5;
def bot08=pLo+dz*8;
def u08=Max(0,Min(1,w08/distributionScale));
def has08=hasProfile and 8<nbLast and s08>0;
plot Dist08=if drawDist and has08 and bn>=edge-Max(1,w08)and bn<=edge then mid08 else na;
Dist08.SetPaintingStrategy(PaintingStrategy.HORIZONTAL);Dist08.SetLineWeight(distributionLineWeight);
Dist08.AssignValueColor(CreateColor(lowRed+redDelta*u08,lowGreen+greenDelta*u08,lowBlue+blueDelta*u08));
Dist08.HideBubble();Dist08.HideTitle();
def heatL08=if drawHeat and has08 and u08<0.67 then bot08+(if u08<0.33 then dz else 0)else na;
AddCloud(heatL08,2*bot08+dz-heatL08,GlobalColor("Heat 0"),GlobalColor("Heat 2"));
def heatH08=if drawHeat and has08 and u08>=0.67 then bot08 else na;
AddCloud(heatH08+dz,heatH08,GlobalColor("Heat 4"),GlobalColor("Heat 4"));
def unit08=if !vMode then 1 else if s08>=1000000000 then 1000000000 else if s08>=1000000 then 1000000 else if s08>=1000 then 1000 else 1;
AddChartBubble(drawScore and has08 and 8%scoreEveryNBins==0,mid08,
(if !vMode then ""+Ceil(s08)else ""+Round(s08/unit08,2))+(if unit08==1000000000 then "B" else if unit08==1000000 then "M" else if unit08==1000 then "K" else ""),
    CreateColor(lowRed+redDelta*u08,lowGreen+greenDelta*u08,lowBlue+blueDelta*u08),yes);

def mid09=pLo+dz*9.5;
def bot09=pLo+dz*9;
def u09=Max(0,Min(1,w09/distributionScale));
def has09=hasProfile and 9<nbLast and s09>0;
plot Dist09=if drawDist and has09 and bn>=edge-Max(1,w09)and bn<=edge then mid09 else na;
Dist09.SetPaintingStrategy(PaintingStrategy.HORIZONTAL);Dist09.SetLineWeight(distributionLineWeight);
Dist09.AssignValueColor(CreateColor(lowRed+redDelta*u09,lowGreen+greenDelta*u09,lowBlue+blueDelta*u09));
Dist09.HideBubble();Dist09.HideTitle();
def heatL09=if drawHeat and has09 and u09<0.67 then bot09+(if u09<0.33 then dz else 0)else na;
AddCloud(heatL09,2*bot09+dz-heatL09,GlobalColor("Heat 0"),GlobalColor("Heat 2"));
def heatH09=if drawHeat and has09 and u09>=0.67 then bot09 else na;
AddCloud(heatH09+dz,heatH09,GlobalColor("Heat 4"),GlobalColor("Heat 4"));
def unit09=if !vMode then 1 else if s09>=1000000000 then 1000000000 else if s09>=1000000 then 1000000 else if s09>=1000 then 1000 else 1;
AddChartBubble(drawScore and has09 and 9%scoreEveryNBins==0,mid09,
(if !vMode then ""+Ceil(s09)else ""+Round(s09/unit09,2))+(if unit09==1000000000 then "B" else if unit09==1000000 then "M" else if unit09==1000 then "K" else ""),
    CreateColor(lowRed+redDelta*u09,lowGreen+greenDelta*u09,lowBlue+blueDelta*u09),yes);

def mid10=pLo+dz*10.5;
def bot10=pLo+dz*10;
def u10=Max(0,Min(1,w10/distributionScale));
def has10=hasProfile and 10<nbLast and s10>0;
plot Dist10=if drawDist and has10 and bn>=edge-Max(1,w10)and bn<=edge then mid10 else na;
Dist10.SetPaintingStrategy(PaintingStrategy.HORIZONTAL);Dist10.SetLineWeight(distributionLineWeight);
Dist10.AssignValueColor(CreateColor(lowRed+redDelta*u10,lowGreen+greenDelta*u10,lowBlue+blueDelta*u10));
Dist10.HideBubble();Dist10.HideTitle();
def heatL10=if drawHeat and has10 and u10<0.67 then bot10+(if u10<0.33 then dz else 0)else na;
AddCloud(heatL10,2*bot10+dz-heatL10,GlobalColor("Heat 0"),GlobalColor("Heat 2"));
def heatH10=if drawHeat and has10 and u10>=0.67 then bot10 else na;
AddCloud(heatH10+dz,heatH10,GlobalColor("Heat 4"),GlobalColor("Heat 4"));
def unit10=if !vMode then 1 else if s10>=1000000000 then 1000000000 else if s10>=1000000 then 1000000 else if s10>=1000 then 1000 else 1;
AddChartBubble(drawScore and has10 and 10%scoreEveryNBins==0,mid10,
(if !vMode then ""+Ceil(s10)else ""+Round(s10/unit10,2))+(if unit10==1000000000 then "B" else if unit10==1000000 then "M" else if unit10==1000 then "K" else ""),
    CreateColor(lowRed+redDelta*u10,lowGreen+greenDelta*u10,lowBlue+blueDelta*u10),yes);

def mid11=pLo+dz*11.5;
def bot11=pLo+dz*11;
def u11=Max(0,Min(1,w11/distributionScale));
def has11=hasProfile and 11<nbLast and s11>0;
plot Dist11=if drawDist and has11 and bn>=edge-Max(1,w11)and bn<=edge then mid11 else na;
Dist11.SetPaintingStrategy(PaintingStrategy.HORIZONTAL);Dist11.SetLineWeight(distributionLineWeight);
Dist11.AssignValueColor(CreateColor(lowRed+redDelta*u11,lowGreen+greenDelta*u11,lowBlue+blueDelta*u11));
Dist11.HideBubble();Dist11.HideTitle();
def heatL11=if drawHeat and has11 and u11<0.67 then bot11+(if u11<0.33 then dz else 0)else na;
AddCloud(heatL11,2*bot11+dz-heatL11,GlobalColor("Heat 0"),GlobalColor("Heat 2"));
def heatH11=if drawHeat and has11 and u11>=0.67 then bot11 else na;
AddCloud(heatH11+dz,heatH11,GlobalColor("Heat 4"),GlobalColor("Heat 4"));
def unit11=if !vMode then 1 else if s11>=1000000000 then 1000000000 else if s11>=1000000 then 1000000 else if s11>=1000 then 1000 else 1;
AddChartBubble(drawScore and has11 and 11%scoreEveryNBins==0,mid11,
(if !vMode then ""+Ceil(s11)else ""+Round(s11/unit11,2))+(if unit11==1000000000 then "B" else if unit11==1000000 then "M" else if unit11==1000 then "K" else ""),
    CreateColor(lowRed+redDelta*u11,lowGreen+greenDelta*u11,lowBlue+blueDelta*u11),yes);

def mid12=pLo+dz*12.5;
def bot12=pLo+dz*12;
def u12=Max(0,Min(1,w12/distributionScale));
def has12=hasProfile and 12<nbLast and s12>0;
plot Dist12=if drawDist and has12 and bn>=edge-Max(1,w12)and bn<=edge then mid12 else na;
Dist12.SetPaintingStrategy(PaintingStrategy.HORIZONTAL);Dist12.SetLineWeight(distributionLineWeight);
Dist12.AssignValueColor(CreateColor(lowRed+redDelta*u12,lowGreen+greenDelta*u12,lowBlue+blueDelta*u12));
Dist12.HideBubble();Dist12.HideTitle();
def heatL12=if drawHeat and has12 and u12<0.67 then bot12+(if u12<0.33 then dz else 0)else na;
AddCloud(heatL12,2*bot12+dz-heatL12,GlobalColor("Heat 0"),GlobalColor("Heat 2"));
def heatH12=if drawHeat and has12 and u12>=0.67 then bot12 else na;
AddCloud(heatH12+dz,heatH12,GlobalColor("Heat 4"),GlobalColor("Heat 4"));
def unit12=if !vMode then 1 else if s12>=1000000000 then 1000000000 else if s12>=1000000 then 1000000 else if s12>=1000 then 1000 else 1;
AddChartBubble(drawScore and has12 and 12%scoreEveryNBins==0,mid12,
(if !vMode then ""+Ceil(s12)else ""+Round(s12/unit12,2))+(if unit12==1000000000 then "B" else if unit12==1000000 then "M" else if unit12==1000 then "K" else ""),
    CreateColor(lowRed+redDelta*u12,lowGreen+greenDelta*u12,lowBlue+blueDelta*u12),yes);

def mid13=pLo+dz*13.5;
def bot13=pLo+dz*13;
def u13=Max(0,Min(1,w13/distributionScale));
def has13=hasProfile and 13<nbLast and s13>0;
plot Dist13=if drawDist and has13 and bn>=edge-Max(1,w13)and bn<=edge then mid13 else na;
Dist13.SetPaintingStrategy(PaintingStrategy.HORIZONTAL);Dist13.SetLineWeight(distributionLineWeight);
Dist13.AssignValueColor(CreateColor(lowRed+redDelta*u13,lowGreen+greenDelta*u13,lowBlue+blueDelta*u13));
Dist13.HideBubble();Dist13.HideTitle();
def heatL13=if drawHeat and has13 and u13<0.67 then bot13+(if u13<0.33 then dz else 0)else na;
AddCloud(heatL13,2*bot13+dz-heatL13,GlobalColor("Heat 0"),GlobalColor("Heat 2"));
def heatH13=if drawHeat and has13 and u13>=0.67 then bot13 else na;
AddCloud(heatH13+dz,heatH13,GlobalColor("Heat 4"),GlobalColor("Heat 4"));
def unit13=if !vMode then 1 else if s13>=1000000000 then 1000000000 else if s13>=1000000 then 1000000 else if s13>=1000 then 1000 else 1;
AddChartBubble(drawScore and has13 and 13%scoreEveryNBins==0,mid13,
(if !vMode then ""+Ceil(s13)else ""+Round(s13/unit13,2))+(if unit13==1000000000 then "B" else if unit13==1000000 then "M" else if unit13==1000 then "K" else ""),
    CreateColor(lowRed+redDelta*u13,lowGreen+greenDelta*u13,lowBlue+blueDelta*u13),yes);

def mid14=pLo+dz*14.5;
def bot14=pLo+dz*14;
def u14=Max(0,Min(1,w14/distributionScale));
def has14=hasProfile and 14<nbLast and s14>0;
plot Dist14=if drawDist and has14 and bn>=edge-Max(1,w14)and bn<=edge then mid14 else na;
Dist14.SetPaintingStrategy(PaintingStrategy.HORIZONTAL);Dist14.SetLineWeight(distributionLineWeight);
Dist14.AssignValueColor(CreateColor(lowRed+redDelta*u14,lowGreen+greenDelta*u14,lowBlue+blueDelta*u14));
Dist14.HideBubble();Dist14.HideTitle();
def heatL14=if drawHeat and has14 and u14<0.67 then bot14+(if u14<0.33 then dz else 0)else na;
AddCloud(heatL14,2*bot14+dz-heatL14,GlobalColor("Heat 0"),GlobalColor("Heat 2"));
def heatH14=if drawHeat and has14 and u14>=0.67 then bot14 else na;
AddCloud(heatH14+dz,heatH14,GlobalColor("Heat 4"),GlobalColor("Heat 4"));
def unit14=if !vMode then 1 else if s14>=1000000000 then 1000000000 else if s14>=1000000 then 1000000 else if s14>=1000 then 1000 else 1;
AddChartBubble(drawScore and has14 and 14%scoreEveryNBins==0,mid14,
(if !vMode then ""+Ceil(s14)else ""+Round(s14/unit14,2))+(if unit14==1000000000 then "B" else if unit14==1000000 then "M" else if unit14==1000 then "K" else ""),
    CreateColor(lowRed+redDelta*u14,lowGreen+greenDelta*u14,lowBlue+blueDelta*u14),yes);

def mid15=pLo+dz*15.5;
def bot15=pLo+dz*15;
def u15=Max(0,Min(1,w15/distributionScale));
def has15=hasProfile and 15<nbLast and s15>0;
plot Dist15=if drawDist and has15 and bn>=edge-Max(1,w15)and bn<=edge then mid15 else na;
Dist15.SetPaintingStrategy(PaintingStrategy.HORIZONTAL);Dist15.SetLineWeight(distributionLineWeight);
Dist15.AssignValueColor(CreateColor(lowRed+redDelta*u15,lowGreen+greenDelta*u15,lowBlue+blueDelta*u15));
Dist15.HideBubble();Dist15.HideTitle();
def heatL15=if drawHeat and has15 and u15<0.67 then bot15+(if u15<0.33 then dz else 0)else na;
AddCloud(heatL15,2*bot15+dz-heatL15,GlobalColor("Heat 0"),GlobalColor("Heat 2"));
def heatH15=if drawHeat and has15 and u15>=0.67 then bot15 else na;
AddCloud(heatH15+dz,heatH15,GlobalColor("Heat 4"),GlobalColor("Heat 4"));
def unit15=if !vMode then 1 else if s15>=1000000000 then 1000000000 else if s15>=1000000 then 1000000 else if s15>=1000 then 1000 else 1;
AddChartBubble(drawScore and has15 and 15%scoreEveryNBins==0,mid15,
(if !vMode then ""+Ceil(s15)else ""+Round(s15/unit15,2))+(if unit15==1000000000 then "B" else if unit15==1000000 then "M" else if unit15==1000 then "K" else ""),
    CreateColor(lowRed+redDelta*u15,lowGreen+greenDelta*u15,lowBlue+blueDelta*u15),yes);

# Adjacent bins cannot BOTH start a peak, so each pair shares one drawing
# slot. Eight slots retain ALL peaks from sixteen bins (no nearest-only cap).

def zone0=if pk00 then lv00 else if pk01 then lv01 else na;
plot SR0=if drawSR then zone0 else na;
SR0.SetPaintingStrategy(PaintingStrategy.HORIZONTAL);SR0.SetStyle(if dashedLines then Curve.SHORT_DASH else Curve.FIRM);SR0.SetLineWeight(lineWeight);
SR0.AssignValueColor(if lastC>zone0 then GlobalColor("Support")else GlobalColor("Resistance"));SR0.HideBubble();SR0.HideTitle();
def zA0=if drawZone then zone0+(if lastC>zone0 then dz/2 else -dz/2)else na;
AddCloud(zA0,2*zone0-zA0,GlobalColor("Support zone"),GlobalColor("Resistance zone"));
def hit0=if checkHits and !IsNaN(zone0)then BounceAt(zone0,lastRange,nextCloseForBounce)else 0;

def zone1=if pk02 then lv02 else if pk03 then lv03 else na;
plot SR1=if drawSR then zone1 else na;
SR1.SetPaintingStrategy(PaintingStrategy.HORIZONTAL);SR1.SetStyle(if dashedLines then Curve.SHORT_DASH else Curve.FIRM);SR1.SetLineWeight(lineWeight);
SR1.AssignValueColor(if lastC>zone1 then GlobalColor("Support")else GlobalColor("Resistance"));SR1.HideBubble();SR1.HideTitle();
def zA1=if drawZone then zone1+(if lastC>zone1 then dz/2 else -dz/2)else na;
AddCloud(zA1,2*zone1-zA1,GlobalColor("Support zone"),GlobalColor("Resistance zone"));
def hit1=if checkHits and !IsNaN(zone1)then BounceAt(zone1,lastRange,nextCloseForBounce)else 0;

def zone2=if pk04 then lv04 else if pk05 then lv05 else na;
plot SR2=if drawSR then zone2 else na;
SR2.SetPaintingStrategy(PaintingStrategy.HORIZONTAL);SR2.SetStyle(if dashedLines then Curve.SHORT_DASH else Curve.FIRM);SR2.SetLineWeight(lineWeight);
SR2.AssignValueColor(if lastC>zone2 then GlobalColor("Support")else GlobalColor("Resistance"));SR2.HideBubble();SR2.HideTitle();
def zA2=if drawZone then zone2+(if lastC>zone2 then dz/2 else -dz/2)else na;
AddCloud(zA2,2*zone2-zA2,GlobalColor("Support zone"),GlobalColor("Resistance zone"));
def hit2=if checkHits and !IsNaN(zone2)then BounceAt(zone2,lastRange,nextCloseForBounce)else 0;

def zone3=if pk06 then lv06 else if pk07 then lv07 else na;
plot SR3=if drawSR then zone3 else na;
SR3.SetPaintingStrategy(PaintingStrategy.HORIZONTAL);SR3.SetStyle(if dashedLines then Curve.SHORT_DASH else Curve.FIRM);SR3.SetLineWeight(lineWeight);
SR3.AssignValueColor(if lastC>zone3 then GlobalColor("Support")else GlobalColor("Resistance"));SR3.HideBubble();SR3.HideTitle();
def zA3=if drawZone then zone3+(if lastC>zone3 then dz/2 else -dz/2)else na;
AddCloud(zA3,2*zone3-zA3,GlobalColor("Support zone"),GlobalColor("Resistance zone"));
def hit3=if checkHits and !IsNaN(zone3)then BounceAt(zone3,lastRange,nextCloseForBounce)else 0;

def zone4=if pk08 then lv08 else if pk09 then lv09 else na;
plot SR4=if drawSR then zone4 else na;
SR4.SetPaintingStrategy(PaintingStrategy.HORIZONTAL);SR4.SetStyle(if dashedLines then Curve.SHORT_DASH else Curve.FIRM);SR4.SetLineWeight(lineWeight);
SR4.AssignValueColor(if lastC>zone4 then GlobalColor("Support")else GlobalColor("Resistance"));SR4.HideBubble();SR4.HideTitle();
def zA4=if drawZone then zone4+(if lastC>zone4 then dz/2 else -dz/2)else na;
AddCloud(zA4,2*zone4-zA4,GlobalColor("Support zone"),GlobalColor("Resistance zone"));
def hit4=if checkHits and !IsNaN(zone4)then BounceAt(zone4,lastRange,nextCloseForBounce)else 0;

def zone5=if pk10 then lv10 else if pk11 then lv11 else na;
plot SR5=if drawSR then zone5 else na;
SR5.SetPaintingStrategy(PaintingStrategy.HORIZONTAL);SR5.SetStyle(if dashedLines then Curve.SHORT_DASH else Curve.FIRM);SR5.SetLineWeight(lineWeight);
SR5.AssignValueColor(if lastC>zone5 then GlobalColor("Support")else GlobalColor("Resistance"));SR5.HideBubble();SR5.HideTitle();
def zA5=if drawZone then zone5+(if lastC>zone5 then dz/2 else -dz/2)else na;
AddCloud(zA5,2*zone5-zA5,GlobalColor("Support zone"),GlobalColor("Resistance zone"));
def hit5=if checkHits and !IsNaN(zone5)then BounceAt(zone5,lastRange,nextCloseForBounce)else 0;

def zone6=if pk12 then lv12 else if pk13 then lv13 else na;
plot SR6=if drawSR then zone6 else na;
SR6.SetPaintingStrategy(PaintingStrategy.HORIZONTAL);SR6.SetStyle(if dashedLines then Curve.SHORT_DASH else Curve.FIRM);SR6.SetLineWeight(lineWeight);
SR6.AssignValueColor(if lastC>zone6 then GlobalColor("Support")else GlobalColor("Resistance"));SR6.HideBubble();SR6.HideTitle();
def zA6=if drawZone then zone6+(if lastC>zone6 then dz/2 else -dz/2)else na;
AddCloud(zA6,2*zone6-zA6,GlobalColor("Support zone"),GlobalColor("Resistance zone"));
def hit6=if checkHits and !IsNaN(zone6)then BounceAt(zone6,lastRange,nextCloseForBounce)else 0;

def zone7=if pk14 then lv14 else if pk15 then lv15 else na;
plot SR7=if drawSR then zone7 else na;
SR7.SetPaintingStrategy(PaintingStrategy.HORIZONTAL);SR7.SetStyle(if dashedLines then Curve.SHORT_DASH else Curve.FIRM);SR7.SetLineWeight(lineWeight);
SR7.AssignValueColor(if lastC>zone7 then GlobalColor("Support")else GlobalColor("Resistance"));SR7.HideBubble();SR7.HideTitle();
def zA7=if drawZone then zone7+(if lastC>zone7 then dz/2 else -dz/2)else na;
AddCloud(zA7,2*zone7-zA7,GlobalColor("Support zone"),GlobalColor("Resistance zone"));
def hit7=if checkHits and !IsNaN(zone7)then BounceAt(zone7,lastRange,nextCloseForBounce)else 0;

# One visible dot per direction per candle; duplicate level hits overlap in Pine.
def anyBear=hit0==-1 or hit1==-1 or hit2==-1 or hit3==-1 or hit4==-1 or hit5==-1 or hit6==-1 or hit7==-1;
def anyBull=hit0==1 or hit1==1 or hit2==1 or hit3==1 or hit4==1 or hit5==1 or hit6==1 or hit7==1;
plot BearBounce=if anyBear then high+safeTick*bounceOffsetTicks else na;
plot BullBounce=if anyBull then low - safeTick*bounceOffsetTicks else na;
BearBounce.SetPaintingStrategy(PaintingStrategy.POINTS);
BullBounce.SetPaintingStrategy(PaintingStrategy.POINTS);
BearBounce.SetDefaultColor(GlobalColor("Resistance"));
BullBounce.SetDefaultColor(GlobalColor("Support"));
BearBounce.SetLineWeight(bounceSize);
BullBounce.SetLineWeight(bounceSize);
BearBounce.HideBubble();
BullBounce.HideBubble();
BearBounce.HideTitle();
BullBounce.HideTitle();

def savedH=HighestAll(if onLast then hSize else na);
def savedL=HighestAll(if onLast then lSize else na);
def peaksFound=pk00+pk01+pk02+pk03+pk04+pk05+pk06+pk07+pk08+pk09+pk10+pk11+pk12+pk13+pk14+pk15;
AddLabel(showDiagnostics,"CP 1.2 | bars "+last+" | H/L "+savedH+"/"+savedL+" | "+
(if IsNaN(hasProfile)then "snapshot missing" else if !hasProfile then "no pivot range"
    else if IsNaN(maxScore)then "score missing" else if maxScore<=0 then "zero scores: check weighting"
    else "score "+Round(maxScore,2)+" | levels "+peaksFound),Color.WHITE);

# Warnings are conditions, not trading signals.
def shortScan=HighestAll(if onLast then((includePivotHigh and GetValue(cntH,searchBars,searchBars)>hCut)or(includePivotLow and GetValue(cntL,searchBars,searchBars)>lCut))else 0);
AddLabel(showWarnings and shortScan,"Pivot scan truncated: increase searchBars",Color.YELLOW);
AddLabel(showWarnings and !hasProfile,"No retained pivots: enable pivot lengths/sides or load more bars",Color.YELLOW);
AddLabel(showWarnings and showPivotAverage and calculateOnLastBarOnly,"MA hidden: calculateOnLastBarOnly is enabled",Color.YELLOW);
# End of study.
Last edited by a moderator: