Repaints MTF Directional Volume Estimate from Price Action For ThinkOrSwim

Repaints

Join useThinkScript to post your question to a community of 21,000+ developers and traders.

Hi,

Anyone able to help to convert this into TOS? Thank you!

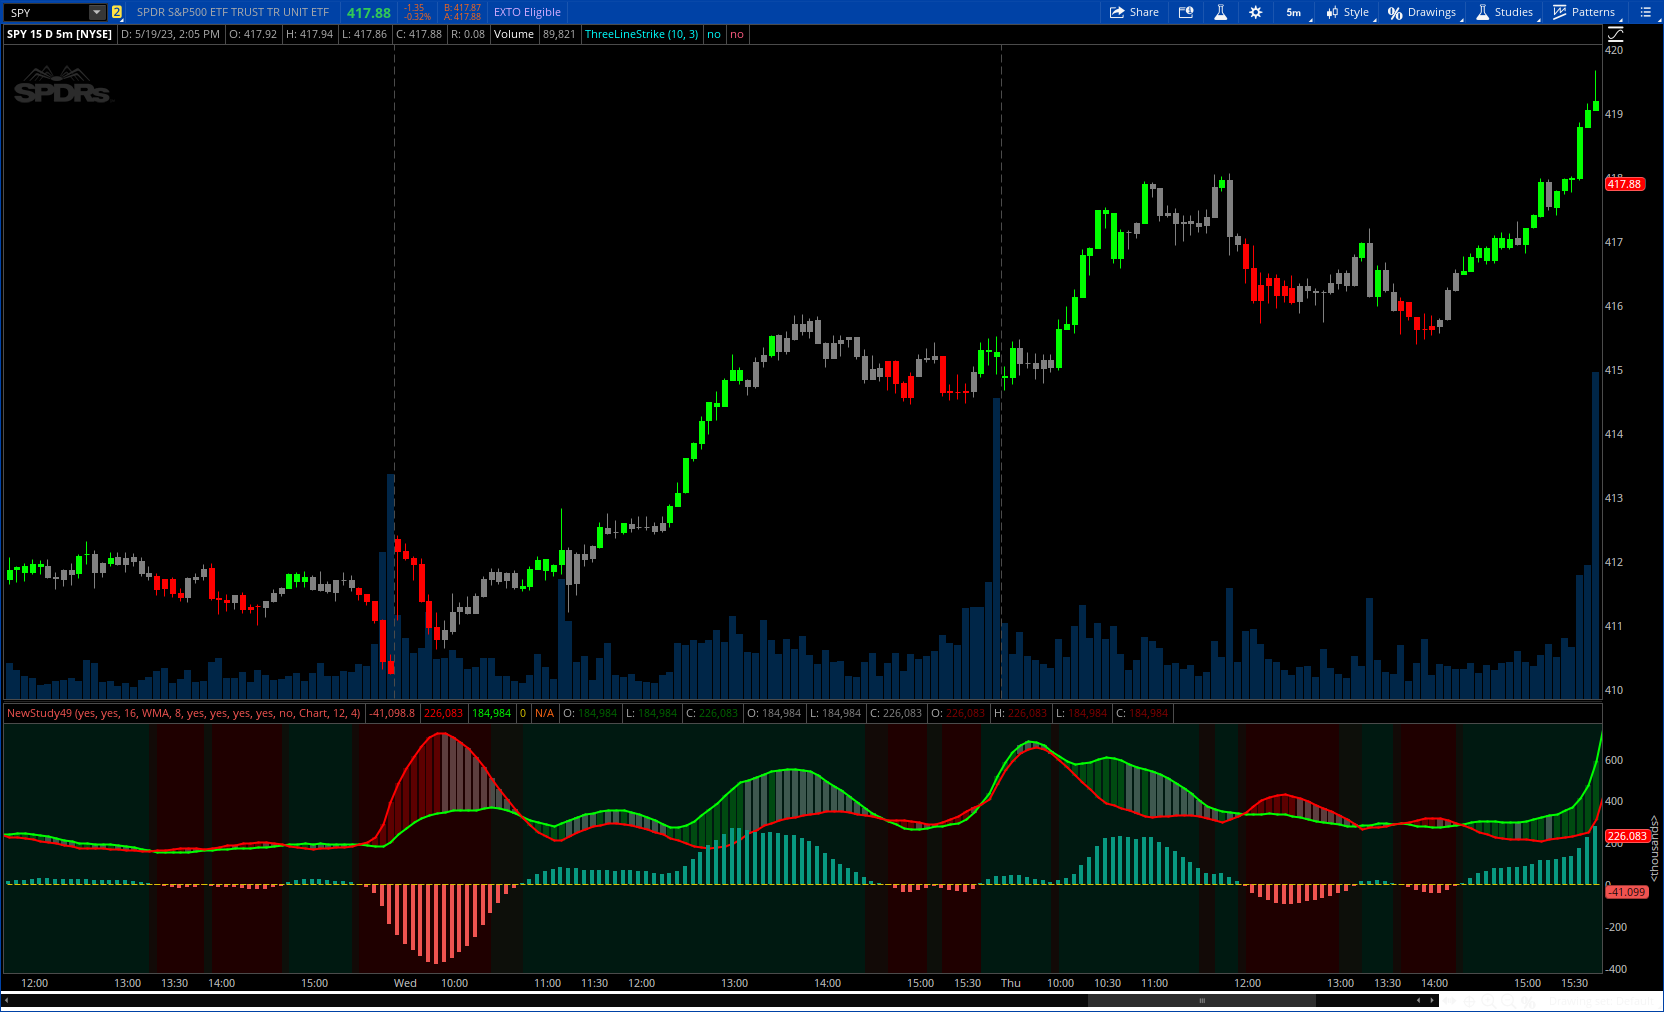
https://www.tradingview.com/script/...lume-EStimate-from-Pirce-Action-RedK-D-VESPA/


// This source code is subject to the terms of the Mozilla Public License 2.0 at https://mozilla.org/MPL/2.0/
// © RedKTrader - May 2023

//@version=5
indicator(title='Directional Volume Estimate from Pirce Action v1.0', shorttitle='RedK D_VESPA v1.0',
format=format.volume, timeframe='', timeframe_gaps=false, explicit_plot_zorder = true)

// Originally this was based on V.Viewer - it estimates and plots average supply & demand volume based on price action
// it uses the shape of a price bar to estimate the supply vs demand split of the traded volume
// & plots a moving average of both, and an estimated Average "Net Volume"
// This provides an insightful way to look at the traded volume compared to the classic volume histogram view
// ---------------------------------
//
// - Supply/Demand calc now includes 2-bar gaps (improved algo)
// - Add option for MA type for calculation
// - Add option to show Net Volume as 3-color bars
// - Visual simplification and improvements to be less distracting & more actionable
// - options to display/hide main visuals while maintaining the status line consistency (Avg Supply, Avg Demand, Avg Net)
// - add alerts for NetVol moving into Buy (crosses 0 up) or Sell (crosses 0 down) modes
// - implement a "sentiment" timeframe - options 1W, 1D, 1H
// using request.scurity() calls to bring in the data from the HTF and pass to the Calc_VESPA function

// ==============================================================================================
GetAverage(_data, _len, MAOption) =>
value = switch MAOption
'SMA' => ta.sma(_data, _len)
'EMA' => ta.ema(_data, _len)
'RMA' => ta.rma(_data, _len)
=>
ta.wma(_data, _len)

// &&&&&&&&&&&&&&&&&&&&&&&&&&&&&&&&&&&&&&&&&&&&&&&&&&&&&&&&&&&&&&&&&&&&&&&&&&&&&&&&&&&&&&&&&&&&&&&&&&&&
Calc_VESPA(bool VolumeOn, bool GapsOn) =>
// *********************************************************************************************************************
// Extrapolate avg estimated Buy & Sell volume per bar
// How the updated buy/sell average estimated volume algo works:
// buy volume is assoicated with price up-moves, sell volume is associated with price down-moves
// so each of the bulls and bears will get the equivalent of the top & bottom wicks,
// for up bars, bulls get the value of the "body", else the bears get the "body"
// open gaps are allocated to bulls or bears depending on the gap direction (if the option is selected)
// if there's no volume, then this will just reflect the price action split between buyers/sellers
// *********************************************************************************************************************
o = open
c = close
h = high
l = low
v = na(volume) or not VolumeOn ? 1 : volume

gap = o - c[1]

bull_gap = math.max(gap, 0)
bear_gap = math.abs(math.min(gap, 0))

body = math.abs(c - o)
BarRange = h - l
wick = BarRange - body

up_bar = c > o

bull = wick + (up_bar ? body : 0) + (GapsOn ? bull_gap : 0)
bear = wick + (up_bar ? 0 : body) + (GapsOn ? bear_gap : 0)

ViRange = bull + bear

// Rare cases with very low TF's (mainly FOREX) where no price movement occurs, ViRange (including gaps) = 0
BScore = ViRange > 0 ? bull / ViRange : 0.5
BuyVol = BScore * v
SellVol = v - BuyVol

// Return Estimated Buy & Sell Volume values
[BuyVol, SellVol]

// *********************************************************************************************************************
// inputs
// *********************************************************************************************************************
length = input.int(title='Volume Length', defval=16, minval=1)
AvgType = input.string("WMA", "Average type", options = ['SMA', 'EMA', 'RMA', 'WMA'])

smooth = input.int(title='Smoothing', defval=8, minval=1)

VolumeWeighted = input.bool(true, "Volume Weighted (Keep on)")
GapImpact = input.bool(true, "2-bar Gap Impact (Keep on)")

ShowNetVolBars = input.bool(true, "Show NetVol Bars")
ShowNetVolHisto = input.bool(true, "Show NetVol Histogram")

// *********************************************************************************************************************
// variables
// *********************************************************************************************************************

// Calculate estimated Buy & Sell colume
[B_BuyVol, B_SellVol] = Calc_VESPA(VolumeWeighted, GapImpact)

// Calc average Buy & Sell vol and NetVol from estimate
demand = ta.wma(GetAverage(B_BuyVol, length, AvgType), smooth)
supply = ta.wma(GetAverage(B_SellVol, length, AvgType), smooth)
NetVol = demand - supply

// *********************************************************************************************************************
// Plots -- classic volume bars have been removed
// *********************************************************************************************************************

col_red = color.new(#ff0000, 00)
col_green = color.new(#00ff00, 00)
col_hist_red = color.new(#ef5350, 25)
col_hist_green = color.new(#089981, 25)

col_gold = color.new(#ffeb3b, 20)

//plot(v, title='Volume', style=plot.style_columns, color=up_bar ? col_green : col_red, display=display.none)


// ======================================================================================================================
// NetVol Bars Plot
// ======================================================================================================================
nvo = fixnan(supply) // fixes NaN values - observed mainly on Renko
nvc = fixnan(demand)
nvh = math.max(nvo, nvc)
nvl = math.min(nvo, nvc)

rising = ta.change(NetVol) > 0


c_barup = color.new(#11ff20, 60)
c_bardn = color.new(#ff1111, 60)
c_bardj = color.new(#ffffff, 50)

c_barupb = color.new(#1b5e20, 50)
c_bardnb = color.new(#981919, 50)
c_bardjb = color.new(#9598a1, 50)

barcolor = nvc > nvo and rising ? c_barup : nvc < nvo and not rising ? c_bardn : c_bardj
borcolor = nvc > nvo and rising ? c_barupb : nvc < nvo and not rising ? c_bardnb : c_bardjb

plotcandle(nvo, nvh, nvl, nvc, 'NetVol Bars', barcolor, barcolor, bordercolor = borcolor,
display = ShowNetVolBars ? display.pane : display.none)

hline(0, title='zero line', linestyle=hline.style_dotted, color=col_gold,
display = ShowNetVolHisto ? display.all : display.none) //hides with histogram

plot(supply, title='Supply', color=col_red, linewidth=2)
plot(demand, title='Demand', color=col_green, linewidth=2)

// ======================================================================================================================
// Net Volume Histogram Plot
// ======================================================================================================================
c_NetVol = NetVol >= 0 ? col_hist_green : col_hist_red
plot(NetVol, title='NetVol Histogram', style=plot.style_columns, color = c_NetVol, linewidth = 4,
display = ShowNetVolHisto ? display.all : display.status_line + display.data_window)


// ======================================================================================================================
// Secondary TF Average Net Volume Plot
// ======================================================================================================================

S_gp = "Secondary TF"

ShowS_NetVol = input.bool(false, 'Show Secondary', group = S_gp, inline = "Senti_TF") // STF plot hidden by default

i_STF = input.string("Chart", 'TF', options = ['Chart', '1Wk', '1Day' , '1Hr'], group = S_gp, inline = "Senti_TF")
S_length = input.int(12, "Length", minval = 1, group = S_gp, inline = "Senti_L")
S_smooth = input.int(4, "Smooth", minval = 1, group = S_gp, inline = "Senti_L")

STF = switch i_STF
'1Wk' => 'W'
'1Day' => 'D'
'1Hr' => '60'
=>
timeframe.period

// Error trap here if selected secondary TF is lower than chart
float chartTF_Mins = timeframe.in_seconds() / 60
float i_STF_Mins = timeframe.in_seconds(STF) / 60
if chartTF_Mins > i_STF_Mins and ShowS_NetVol
runtime.error("Secondary timeframe must be equal to, or higher than, the chart's timeframe.")


[S_BuyVol, S_SellVol] = request.security(syminfo.tickerid, STF, Calc_VESPA(VolumeWeighted, GapImpact) )

S_demand = request.security(syminfo.tickerid, STF, ta.wma(GetAverage(S_BuyVol, S_length, AvgType), S_smooth))
S_supply = request.security(syminfo.tickerid, STF, ta.wma(GetAverage(S_SellVol, S_length, AvgType), S_smooth))

S_NetVol = S_demand - S_supply

c_S_NetVol = S_NetVol >= 0 ? color.aqua : color.orange
plot(S_NetVol, title='Secondary TF NetVol', color = c_S_NetVol, linewidth = 2,
display = ShowS_NetVol ? display.all : display.data_window)

// plot(S_supply, color = color.red)
// plot(S_demand, color = color.green)

// ======================================================================================================================
// Alerts
// ======================================================================================================================

// Primary TF Alerts
Al_NetVol_up = ta.crossover(NetVol, 0)
Al_NetVol_dn = ta.crossunder(NetVol, 0)
Al_NetVol_swing = Al_NetVol_up or Al_NetVol_dn

alertcondition(Al_NetVol_up, "A1. Avg NetVol Crossing 0 Up", "Avg NetVol Positive - Bullish Mode Detected!")
alertcondition(Al_NetVol_dn, "A2. Avg NetVol Crossing 0 Down", "Avg NetVol Negative - Bearish Mode Detected!")
alertcondition(Al_NetVol_swing, "A3. Avg NetVol Crossing 0", "Avg NetVol Swing - Possible Mode Reversal Detected!")

// Secondary TF Alerts
Al_SNetVol_up = ta.crossover(S_NetVol, 0)
Al_SNetVol_dn = ta.crossunder(S_NetVol, 0)
Al_SNetVol_swing = Al_SNetVol_up or Al_SNetVol_dn

alertcondition(Al_SNetVol_up, "B1. STF Avg NetVol Crossing 0 Up", "Secondary TF Avg NetVol Positive - Bullish Mode Detected!")
alertcondition(Al_SNetVol_dn, "B2. STF Avg NetVol Crossing 0 Down", "Secondary TF Avg NetVol Negative - Bearish Mode Detected!")
alertcondition(Al_SNetVol_swing, "B3. STF Avg NetVol Crossing 0", "Secondary TF Avg NetVol Swing - Possible Mode Reversal Detected!")
find below
3EOSN5l.png

CODE:

Code:
#// This source code is subject to the terms of the Mozilla Public License 2.0 at https://mozilla.org/MPL/2.0/
#// © RedKTrader - May 2023
#indicator(title='Directional Volume Estimate from Pirce Action v1.0', shorttitle='RedK D_VESPA v1.0',
# Converted by Sam4Cok@Samer800    - 05/2023
declare lower;
#GetAverage(_data, _len, MAOption) =>
script GetAverage {
    input _data = close;
    input _len = 16;
    input MAOption = "SMA";
    def value = if MAOption == "SMA" then Average(_data, _len) else
                if MAOption == "EMA" then ExpAverage(_data, _len) else
                if MAOption == "RMA" then WildersAverage(_data, _len) else WMA(_data, _len);
    plot out = value;
}
#Calc_VESPA(bool VolumeOn, bool GapsOn) =>
script Calc_VESPA {
    input o = open;
    input c = close;
    input h = high;
    input l = low;
    input vol = volume;
    input VolumeOn = yes;
    input GapsOn = yes;

    def v = if IsNaN(vol) or !VolumeOn then 1 else vol;
    def gap         = o - c[1];
    def bull_gap    = Max(gap, 0);
    def bear_gap    = AbsValue(Min(gap, 0));
    def body        = AbsValue(c - o);
    def BarRange    = h - l;
    def wick        = BarRange - body;
    def up_bar      = c > o;
    def bull        = wick + (if up_bar then body else 0) + (if GapsOn then bull_gap else 0);
    def bear        = wick + (if up_bar then 0 else body) + (if GapsOn then bear_gap else 0);
    def ViRange     = bull + bear;
#    // Rare cases with very low TF's (mainly FOREX) where no price movement occurs, ViRange (including gaps) = 0
    def BScore      = if ViRange > 0 then bull / ViRange else 0.5;
    def BuyVol      = BScore * v;
    def SellVol     = v - BuyVol;
#  // Return Estimated Buy & Sell Volume values
    plot buy = BuyVol;
    plot sell = SellVol;
}
#// inputs
input BarColor    = yes;
input ShowBackground = yes;
input VolumeLength   = 16;       # 'Volume Length'
input AvgType     = {"SMA", "EMA", "RMA", default "WMA"};    # "Average type"
input Smoothing   = 8;           # 'Smoothing'
input VolumeWeightedOn = yes;    # "Volume Weighted (Keep on)"
input GapImpact        = yes;    # "2-bar Gap Impact (Keep on)"
input ShowNetVolBars   = yes;    # "Show NetVol Bars"
input ShowNetVolHisto  = yes;    # "Show NetVol Histogram"
input ShowSecondaryNetVol  = no; # 'Show Secondary'
input SelectTimeframe      = {Default "Chart", "1Wk", "1Day" , "1Hr"};
input SecondaryLength      = 12;#, "Length", minval = 1, group = S_gp, inline = "Senti_L")
input SecondarySmoothing   = 4;#, "Smooth", minval = 1, group = S_gp, inline = "Senti_L")


def na = Double.NaN;
def last = isNaN(close);
def pos = Double.POSITIVE_INFINITY;
def neg = Double.NEGATIVE_INFINITY;
def length = VolumeLength;
def ShowS_NetVol = ShowSecondaryNetVol;
def S_length = SecondaryLength;
def S_smooth = SecondarySmoothing;
#-- Color
DefineGlobalColor("up", Color.DARK_GREEN);
DefineGlobalColor("dn", Color.DARK_RED);
DefineGlobalColor("green", CreateColor(8,153,129));
DefineGlobalColor("red", CreateColor(239,83,80));
DefineGlobalColor("gold", CreateColor(216, 194, 0));
DefineGlobalColor("bgreen", CreateColor(1, 50, 32));
DefineGlobalColor("bred", CreateColor(61, 0, 0));

#// Calculate estimated Buy & Sell colume
def B_BuyVol = Calc_VESPA(open, close, high, low, volume, VolumeWeightedOn, GapImpact).buy;
def B_SellVol = Calc_VESPA(open, close, high, low, volume, VolumeWeightedOn, GapImpact).sell;

#// Calc average Buy & Sell vol and NetVol from estimate
def demand      = WMA(GetAverage(B_BuyVol, length, AvgType), Smoothing);
def supply      = WMA(GetAverage(B_SellVol, length, AvgType), Smoothing);
def NetVol      = demand - supply;

#// ********************************
#/ NetVol Bars Plot
def nvo = supply;
def nvc = demand;
def nvh = Max(nvo, nvc);
def nvl = Min(nvo, nvc);
def rising      = (NetVol - NetVol[1]) > 0;

def col = if nvc > nvo and rising then 1 else
          if nvc < nvo and !rising then -1 else 0;

#// Net Volume Histogram Plot

def c_NetVol = NetVol >= 0;

plot NetVolHist = if ShowNetVolHisto then NetVol else na;    # 'NetVol Histogram'
NetVolHist.SetLineWeight(4);
NetVolHist.SetPaintingStrategy(PaintingStrategy.HISTOGRAM);
NetVolHist.AssignValueColor(if c_NetVol then GlobalColor("green") else GlobalColor("red"));

plot supplyLine = supply;    # 'Supply'
plot demandLine = demand;    # 'Demand'
supplyLine.SetLineWeight(2);
demandLine.SetLineWeight(2);
supplyLine.SetDefaultColor(Color.RED);
demandLine.SetDefaultColor(Color.GREEN);

AddChart(high = if ShowNetVolBars and col>0 then nvh else na, low = nvl , open = nvc,  close = nvo,
         type = ChartType.CANDLE, growcolor = GlobalColor("up"));
AddChart(high = if ShowNetVolBars and col==0 then nvh else na, low = nvl , open = if !rising then nvc else nvo,
                close = if !rising then nvo else nvc,
         type = ChartType.CANDLE, growcolor =  Color.GRAY);
AddChart(high = if ShowNetVolBars and col<0 then nvh else na, low = nvl , open = nvo,  close = nvc,
         type = ChartType.CANDLE, growcolor =  GlobalColor("dn"));

plot hline = if last or !ShowNetVolHisto then na else 0;    # 'zero line'
hline.SetDefaultColor(GlobalColor("gold"));
hline.SetPaintingStrategy(PaintingStrategy.DASHES);

#// Secondary TF Average Net Volume Plot
def STF;
switch(SelectTimeframe) {
case "Chart" :
    STF = GetAggregationPeriod();
case "1Wk" :
    STF = AggregationPeriod.WEEK;
case "1Day" :
    STF = AggregationPeriod.DAY;
case "1Hr" :
    STF = AggregationPeriod.HOUR;
}
def o = open(Period=STF);
def c = close(Period=STF);
def h = high(Period=STF);
def l = low(Period=STF);
def v = volume(Period=STF);

def S_BuyVol = Calc_VESPA(o, c, h, l, v, VolumeWeightedOn, GapImpact).buy;
def S_SellVol = Calc_VESPA(o, c, h, l, v, VolumeWeightedOn, GapImpact).sell;

def S_demand = wma(GetAverage(S_BuyVol, S_length, AvgType), S_smooth);
def S_supply = wma(GetAverage(S_SellVol, S_length, AvgType), S_smooth);

def S_NetVol      = S_demand - S_supply;

def c_S_NetVol = S_NetVol >= 0;
plot SecondaryTFNetVol = if ShowS_NetVol then S_NetVol else na;    # 'Secondary TF NetVol'
SecondaryTFNetVol.SetLineWeight(2);
SecondaryTFNetVol.AssignValueColor(if c_S_NetVol then Color.CYAN else Color.DOWNTICK);

#/ Alerts
#// Primary TF Alerts
def Al_NetVol_up    = if ShowBackground then NetVol>= 0 else na;

AddCloud(if Al_NetVol_up then pos else neg, if Al_NetVol_up then neg else pos, GlobalColor("bgreen"), GlobalColor("bred"));

#// Secondary TF Alerts
def Al_SNetVol_up    = if ShowBackground then S_NetVol> 0 else na;
AddCloud(if Al_SNetVol_up then pos else neg, if Al_SNetVol_up then neg else pos, GlobalColor("bgreen"), GlobalColor("bred"));

#-- Bar Color
AssignPriceColor(if !Barcolor then Color.CURRENT else
                 if col>0 then Color.GREEN else
                 if col<0 then Color.RED else Color.GRAY);


#--- END of CODE
wow samer ty very much
 
I have good trade with this indicator ty Samer could u please allow us to use candle color for 5min and 10min in one min chart ?
 
Can you make scanner this works really good ..when red line cross green line and green line cross red line... please samar800 happy trading
Thanks 🙏🙏 in advance
 

Similar threads

Not the exact question you're looking for?

Start a new thread and receive assistance from our community.

87k+ Posts
506 Online
Create Post

Similar threads

Similar threads

The Market Trading Game Changer

Join 2,500+ subscribers inside the useThinkScript VIP Membership Club
  • Exclusive indicators
  • Proven strategies & setups
  • Private Discord community
  • ‘Buy The Dip’ signal alerts
  • Exclusive members-only content
  • Add-ons and resources
  • 1 full year of unlimited support

Frequently Asked Questions

What is useThinkScript?

useThinkScript is the #1 community of stock market investors using indicators and other tools to power their trading strategies. Traders of all skill levels use our forums to learn about scripting and indicators, help each other, and discover new ways to gain an edge in the markets.

How do I get started?

We get it. Our forum can be intimidating, if not overwhelming. With thousands of topics, tens of thousands of posts, our community has created an incredibly deep knowledge base for stock traders. No one can ever exhaust every resource provided on our site.

If you are new, or just looking for guidance, here are some helpful links to get you started.

What are the benefits of VIP Membership?
VIP members get exclusive access to these proven and tested premium indicators: Buy the Dip, Advanced Market Moves 2.0, Take Profit, and Volatility Trading Range. In addition, VIP members get access to over 50 VIP-only custom indicators, add-ons, and strategies, private VIP-only forums, private Discord channel to discuss trades and strategies in real-time, customer support, trade alerts, and much more. Learn all about VIP membership here.
How can I access the premium indicators?
To access the premium indicators, which are plug and play ready, sign up for VIP membership here.
Back
Top