chiropteraphile
New member
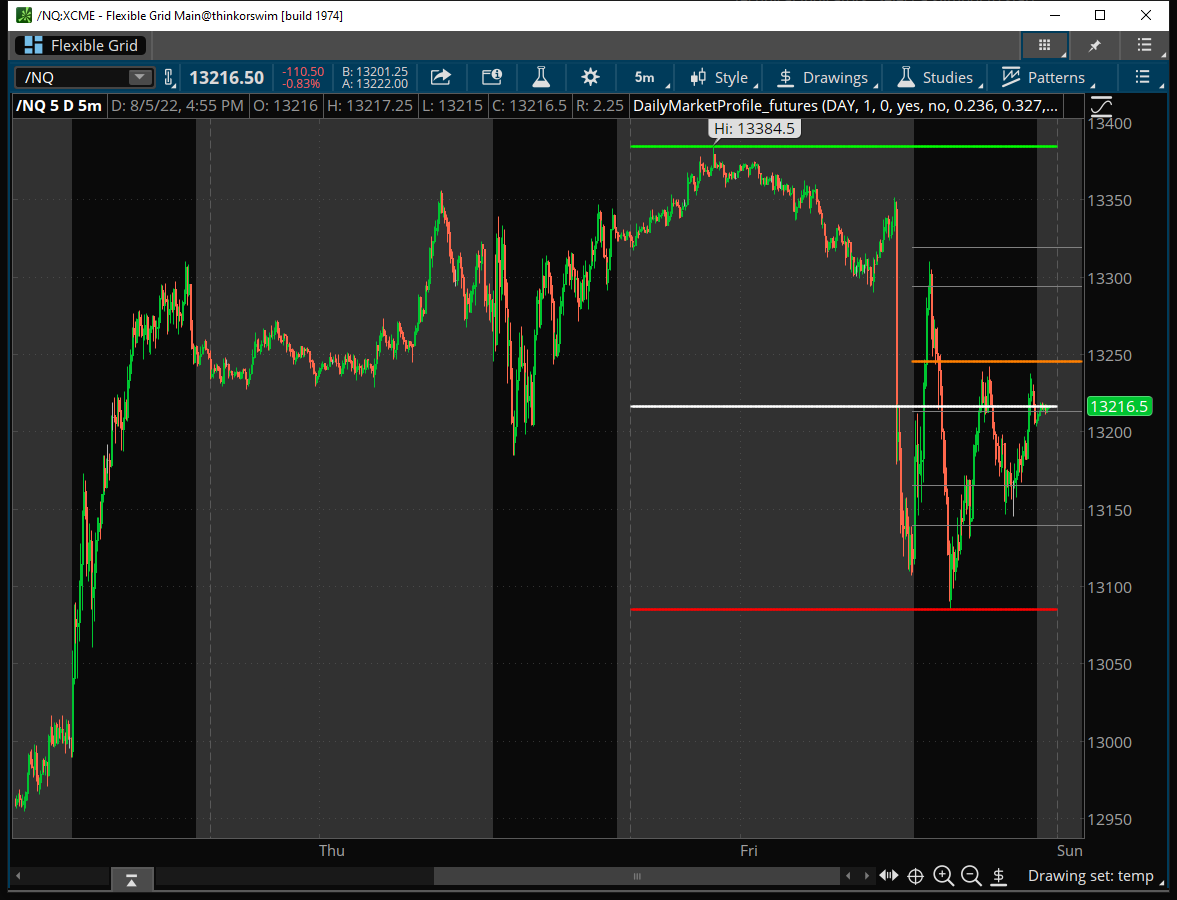
Plots the pervious day's close, high, low, and halfback, the overnight high and low, and fib levels for futures.
Combine with my DailyLevels script (https://usethinkscript.com/threads/dailylevels-script.12073) for trading with intraday price levels.
Combine with my DailyLevels script (https://usethinkscript.com/threads/dailylevels-script.12073) for trading with intraday price levels.
Code:
#
#DailyMarketProfile script (futures version)
#@chiropteraphile  7/30/2022
declare hide_on_daily;
input aggregationPeriod = AggregationPeriod.DAY;
input length = 1;
input displace = -1;
input showOnlyLastPeriod = no;

plot PrevDayClose;
Plot PrevDayHigh;
Plot PrevDayLow;

if showOnlyLastPeriod and !IsNaN(close(period = aggregationPeriod)[-1]) { PrevDayClose = Double.NaN;
} else { PrevDayClose = Highest(close(period = aggregationPeriod)[-displace], length);
}

PrevDayClose.SetDefaultColor(Color.White);
PrevDayClose.SetPaintingStrategy(PaintingStrategy.Line);
PrevDayClose.SetStyle(Curve.Firm);
PrevDayClose.SetLineWeight(2);
PrevDayClose.HideBubble();
PrevDayClose.HideTitle();

if showOnlyLastPeriod and !IsNaN(high(period = aggregationPeriod)[-1]) { PrevDayHigh = Double.NaN;
} else { PrevDayHigh = Highest(high(period = aggregationPeriod)[-displace], length);
}

PrevDayHigh.SetDefaultColor(Color.Green);
PrevDayHigh.SetPaintingStrategy(PaintingStrategy.Line);
PrevDayHigh.SetStyle(Curve.Firm);
PrevDayHigh.SetLineWeight(2);
PrevDayHigh.HideBubble();
PrevDayHigh.HideTitle();

if showOnlyLastPeriod and !IsNaN(Low(period = aggregationPeriod)[-1]) { PrevDayLow = Double.NaN;
} else { PrevDayLow = Highest(Low(period = aggregationPeriod)[-displace], length);
}

PrevDayLow.SetDefaultColor(Color.Red);
PrevDayLow.SetPaintingStrategy(PaintingStrategy.Line);
PrevDayLow.SetStyle(Curve.Firm);
PrevDayLow.SetLineWeight(2);
PrevDayLow.HideBubble();
PrevDayLow.HideTitle();

input PlotOverNightExtremes = yes;
input coeff_1 = .236;
input coeff_2 = .327;
input coeff_3 = .500;
input coeff_4 = .618;
input coeff_5 = .789;
input coeff_6 = .882;

def o = open;
def h = high;
def l = low;
def c = close;
def v = volume;
def bar = BarNumber();
def GlobeX = GetTime() < RegularTradingStart(GetYYYYMMDD());
def vol = if GlobeX and !Globex[1]
then v
else if GlobeX
then vol[1] + v
else Double.NaN;

def GlobeX_Volume = vol;
def ONhigh = if GlobeX and !Globex[1]
then h
else if Globex and
h > ONhigh[1]
then h
else ONhigh[1];
def ONhighBar = if GlobeX and h == ONhigh
then Bar
else double.nan;


def ONlow = if GlobeX and !GlobeX[1]
then l
else if GlobeX and
l < ONlow[1]
then l
else ONlow[1];

def ONlowBar = if GlobeX and l == ONlow
then Bar
else double.nan;

def OverNightHigh = if BarNumber() == HighestAll(ONhighBar)
then ONhigh
else OverNightHigh[1];

def OverNightLow = if BarNumber() == HighestAll(ONlowBar)
then ONlow
else OverNightLow[1];

plot ONH = if OverNightHigh > 0
then OverNightHigh
else Double.NaN;

ONH.SetHiding(!PlotOverNightExtremes);
ONH.SetPaintingStrategy(PaintingStrategy.Line);
ONH.SetDefaultColor(Color.Light_Green);
ONH.SetStyle(Curve.Firm);
ONH.SetLineWeight(2);
ONH.HideBubble();
ONH.HideTitle();

plot ONL = if OverNightLow > 0
then OverNightLow
else Double.NaN;

ONL.SetHiding(!PlotOverNightExtremes);
ONL.SetPaintingStrategy(PaintingStrategy.Line);
ONL.SetDefaultColor(Color.Light_Red);
ONL.SetStyle(Curve.Firm);
ONL.SetLineWeight(2);
ONL.HideBubble();
ONL.HideTitle();

def MaxBar = Max(HighestAll(ONhighBar), HighestAll(ONlowBar));

plot coeff1 = if HighestAll(ONhighBar) == MaxBar and OverNightLow > 0 and OverNightHigh > 0
then ((OverNightHigh - OverNightLow) * coeff_1) + OverNightLow
else if HighestAll(ONlowBar) == MaxBar and OverNightLow > 0 and OverNightHigh > 0
then OverNightHigh - ((OverNightHigh - OverNightLow) * coeff_1)
else double.nan;

coeff1.SetDefaultColor(Color.Gray);
coeff1.SetPaintingStrategy(PaintingStrategy.Line);
coeff1.SetStyle(Curve.Firm);
coeff1.SetLineWeight(1);
coeff1.HideBubble();
coeff1.HideTitle();

plot coeff2 = if HighestAll(ONhighBar) == MaxBar and OverNightLow > 0 and OverNightHigh > 0
then ((OverNightHigh - OverNightLow) * coeff_2) + OverNightLow
else if HighestAll(ONlowBar) == MaxBar and OverNightLow > 0 and OverNightHigh > 0
then OverNightHigh - ((OverNightHigh - OverNightLow) * coeff_2)
else double.nan;

coeff2.SetDefaultColor(Color.Gray);
coeff2.SetPaintingStrategy(PaintingStrategy.Line);
coeff2.SetStyle(Curve.Firm);
coeff2.SetLineWeight(1);
coeff2.HideBubble();
coeff2.HideTitle();

plot Halfback = if HighestAll(ONhighBar) == MaxBar and OverNightLow > 0 and OverNightHigh > 0
then ((OverNightHigh - OverNightLow) * coeff_3) + OverNightLow
else if HighestAll(ONlowBar) == MaxBar and OverNightLow > 0 and OverNightHigh > 0
then OverNightHigh - ((OverNightHigh - OverNightLow) * coeff_3)
else double.nan;

Halfback.SetDefaultColor(Color.Dark_Orange);
Halfback.SetPaintingStrategy(PaintingStrategy.Line);
Halfback.SetStyle(Curve.Firm);
Halfback.SetLineWeight(2);
Halfback.HideBubble();
Halfback.HideTitle();

plot coeff4 = if HighestAll(ONhighBar) == MaxBar and OverNightLow > 0 and OverNightHigh > 0
then ((OverNightHigh - OverNightLow) * coeff_4) + OverNightLow
else if HighestAll(ONlowBar) == MaxBar and OverNightLow > 0 and OverNightHigh > 0
then OverNightHigh - ((OverNightHigh - OverNightLow) * coeff_4)
else double.nan;

coeff4.SetDefaultColor(Color.Gray);
coeff4.SetPaintingStrategy(PaintingStrategy.Line);
coeff4.SetStyle(Curve.Firm);
coeff4.SetLineWeight(1);
coeff4.HideBubble();
coeff4.HideTitle();

plot coeff5 = if HighestAll(ONhighBar) == MaxBar and OverNightLow > 0 and OverNightHigh > 0
then ((OverNightHigh - OverNightLow) * coeff_5) + OverNightLow
else if HighestAll(ONlowBar) == MaxBar and OverNightLow > 0 and OverNightHigh > 0
then OverNightHigh - ((OverNightHigh - OverNightLow) * coeff_5)
else double.nan;
coeff5.SetDefaultColor(Color.Gray);

coeff5.SetPaintingStrategy(PaintingStrategy.Line);
coeff5.SetStyle(Curve.Firm);
coeff5.SetLineWeight(1);
coeff5.HideBubble();
coeff5.HideTitle();

plot coeff6 = if HighestAll(ONhighBar) == MaxBar and OverNightLow > 0 and OverNightHigh > 0
then ((OverNightHigh - OverNightLow) * coeff_6) + OverNightLow
else if HighestAll(ONlowBar) == MaxBar and OverNightLow > 0 and OverNightHigh > 0
then OverNightHigh - ((OverNightHigh - OverNightLow) * coeff_6)
else double.nan;

coeff6.SetDefaultColor(Color.Gray);
coeff6.SetPaintingStrategy(PaintingStrategy.Line);
coeff6.SetStyle(Curve.Firm);
coeff6.SetLineWeight(1);
coeff6.HideBubble();
coeff6.HideTitle();
#
Last edited by a moderator: