
Johnny Cash
Member
9909[/ATTACH]']

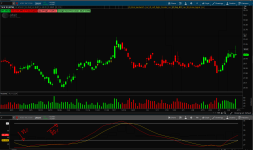
I am looking for help on assigning price color to chart as stochastics change. Bellow is what i got so far, but nothing that i have tried seems to work.
what i want to accomplish;
1-Fullk cross higher than Fulld, color green
2-Stay red bellow over_sold line ( 32%) regardless
3-Fulld cross lower than fullk, color red
Fullk (red)
fulld (yellow)
Code:
# Color coded weekly chart for stochastics

input over_bought = 80;
input over_sold = 32;
input aggregationPeriod = AggregationPeriod.WEEK;
input KPeriod = 10;
input DPeriod = 3;
input slowing_period = 3;
#input slowk =10;
#input slowd = 3;
#input percentchg = close;
plot FullK = Average((close(period = aggregationPeriod) - Lowest(low(period = aggregationPeriod), KPeriod)) / (Highest(high(period = aggregationPeriod), KPeriod) - Lowest(low(period = aggregationPeriod), KPeriod)) * 100, slowing_period);
plot FullD = Average(Average((close(period = aggregationPeriod) - Lowest(low(period = aggregationPeriod), KPeriod)) / (Highest(high(period = aggregationPeriod), KPeriod) - Lowest(low(period = aggregationPeriod), KPeriod)) * 100, slowing_period), DPeriod);

plot OverBought = over_bought;
plot OverSold = over_sold;

AssignpriceColor(if Fullk > FullD then color.green else color.red);


plot value = FullK;
Attachments
Last edited by a moderator: