Vinnertrade
New member
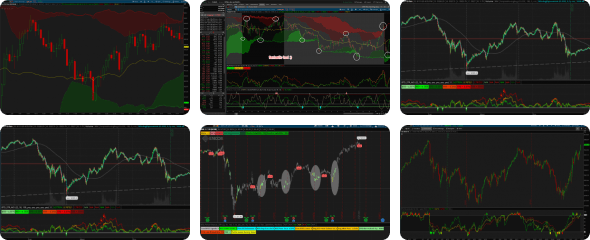
Can someone please help create a scanner and watchlist column for the following indicator?
I understand that the indicator references future candles, which are not supported in Thinkorswim scanners. I am looking for a scanner-compatible version that works only with confirmed/current and historical bars.
I understand that the indicator references future candles, which are not supported in Thinkorswim scanners. I am looking for a scanner-compatible version that works only with confirmed/current and historical bars.
Desired scanner behavior
- A ticker should appear in the scan when a buy signal is triggered.
- It should remain in the scan results until a sell signal is triggered.
- Conversely, once a sell signal occurs, the ticker should no longer appear in the buy-signal scan.
Desired watchlist column
I would also like a custom watchlist column that displays:- The current signal state: Buy, Sell, or Neutral/Blank.
- The price at which the most recent active signal was triggered—for example, the entry price from the latest buy signal.
Code:
input signalOffsetFactor = 0.20;

def signalOffset = Average(TrueRange(high, close, low), 9) * signalOffsetFactor;
plot Data = hlc3;

def triggerSell = If(If(close[-1] < high, 1, 0) and (hlc3[-2] < close[-1] or hlc3[-3] < close[-1]), 1, 0);

def triggerBuy = If(If(close[-1] > low, 1, 0) and (hlc3[-2] > close[-1] or hlc3[-3] > close[-1]), 1, 0);

rec buySellSwitch = If(triggerSell, 1, If(triggerBuy, 0, buySellSwitch[1]));

def thirdBarClosed = If(IsNaN(hlc3[-3]), 0, 1);

plot SBS = If(triggerSell and thirdBarClosed and !buySellSwitch[1], high + signalOffset, If(triggerBuy and thirdBarClosed and buySellSwitch[1], low - signalOffset, Double.NaN));

SBS.SetStyle(Curve.FIRM);
SBS.SetPaintingStrategy(PaintingStrategy.LINE_VS_POINTS);
SBS.SetLineWeight(2);

SBS.AssignValueColor(if triggerSell then
if thirdBarClosed then
#UpPos
CreateColor(255, 0, 0) else
#UpNeg
CreateColor(255, 0, 0)
else if triggerBuy then
#DnPos
CreateColor(0, 255, 0) else
#DnNeg
CreateColor(0, 255, 0));

# --------------------------------------------------
# BUY ARROW
# --------------------------------------------------

plot BuyArrow =
    If(triggerBuy and thirdBarClosed and buySellSwitch[1],
       low - signalOffset,
       Double.NaN);

BuyArrow.SetPaintingStrategy(PaintingStrategy.ARROW_UP);
BuyArrow.SetDefaultColor(Color.GREEN);
BuyArrow.SetLineWeight(2);

# --------------------------------------------------
# SELL ARROW
# --------------------------------------------------

plot SellArrow =
    If(triggerSell and thirdBarClosed and !buySellSwitch[1],
       high + signalOffset,
       Double.NaN);

SellArrow.SetPaintingStrategy(PaintingStrategy.ARROW_DOWN);
SellArrow.SetDefaultColor(Color.RED);
SellArrow.SetLineWeight(2);

# --------------------------------------------------
# BUY BUBBLE
# --------------------------------------------------

AddChartBubble(
    triggerBuy and thirdBarClosed and buySellSwitch[1],
    low - signalOffset,
    "B " + AsPrice(close),
    Color.GREEN,
    no
);

# --------------------------------------------------
# SELL BUBBLE
# --------------------------------------------------

AddChartBubble(
    triggerSell and thirdBarClosed and !buySellSwitch[1],
    high + signalOffset,
    "S " + AsPrice(close),
    Color.RED,
    yes
);
Last edited by a moderator: