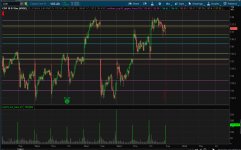
this is a lower study, that will color the 10 highest volume bars.
if you want it to appear on the volume chart, disable the 'declare lower' line, and drag the name into the volume chart section.

https://tlc.thinkorswim.com/center/reference/thinkScript/Functions/Look---Feel/AssignValueColor
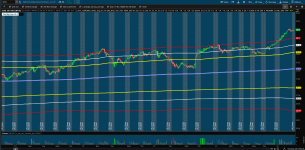
might be able to use the priceline code, with 1000 offset instead of highestall...
https://usethinkscript.com/threads/current-price-line-indicator-for-thinkorswim.8793/
if you want it to appear on the volume chart, disable the 'declare lower' line, and drag the name into the volume chart section.
Ruby:
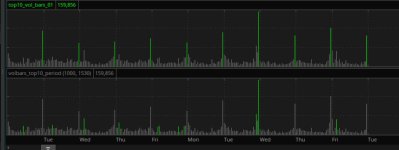
# top10_vol_bars_01

# color the top 10 vol bars

declare lower;

def na = Double.NaN;
def bn = BarNumber();

def v = volume;
# use highestall x times

def v1 = highestall( v );
def v2 = highestall( if v < v1 then v else 0);
def v3 = highestall( if v < v2 then v else 0);
def v4 = highestall( if v < v3 then v else 0);
def v5 = highestall( if v < v4 then v else 0);
def v6 = highestall( if v < v5 then v else 0);
def v7 = highestall( if v < v6 then v else 0);
def v8 = highestall( if v < v7 then v else 0);
def v9 = highestall( if v < v8 then v else 0);
def v10 = highestall( if v < v9 then v else 0);

def x1 = if v == v1 then 1 else 0;
def x2 = if v == v2 then 1 else 0;
def x3 = if v == v3 then 1 else 0;
def x4 = if v == v4 then 1 else 0;
def x5 = if v == v5 then 1 else 0;
def x6 = if v == v6 then 1 else 0;
def x7 = if v == v7 then 1 else 0;
def x8 = if v == v8 then 1 else 0;
def x9 = if v == v9 then 1 else 0;
def x10 = if v == v10 then 1 else 0;

def bars = (x1 or x2 or x3 or x4 or x5 or x6 or x7 or x8 or x9 or x10);

plot z = v;
z.SetPaintingStrategy(PaintingStrategy.HISTOGRAM);
z.AssignValueColor(if bars then color.green else color.gray);
#
https://tlc.thinkorswim.com/center/reference/thinkScript/Functions/Look---Feel/AssignValueColor
might be able to use the priceline code, with 1000 offset instead of highestall...
https://usethinkscript.com/threads/current-price-line-indicator-for-thinkorswim.8793/