ADR Plot help

childishtey

New member
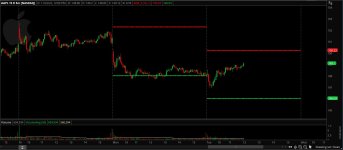
Hey, does anyone know how to edit this ADR plot script that will allow me to manually choose how many days I want plotted. I mainly want to see ADR plot for the current day's trading, but I also want to be able to choose the amount of days I can go back for back testing.

#The number of days you'd like average
input lenght = 21;

def dayHigh = DailyHighLow(AggregationPeriod.DAY).Dailyhigh;
def dayLow = DailyHighLow(AggregationPeriod.DAY).DailyLow;
def dayrange = dayHigh - dayLow;
def AvgRange = Average(dayrange, lenght);

plot ADR_H = open(period = AggregationPeriod.DAY) + (AvgRange/2);
plot ADR_L = open(period = AggregationPeriod.DAY) - (AvgRange/2);


https%3A//i.imgur.com/H3IcGWV.jpg[/img]']
H3IcGWV.jpg
 
Last edited:
Solution
@childishtey this should work.

Ruby:
input lenght = 21;
input Days_to_Plot = 3;

def dayHigh = DailyHighLow(AggregationPeriod.DAY).Dailyhigh;
def dayLow = DailyHighLow(AggregationPeriod.DAY).DailyLow;
def dayrange = dayHigh - dayLow;
def AvgRange = Average(dayrange, lenght);

plot ADR_H = if GetLastDay() - GetDay() <= Days_to_Plot + 1 then open(period = AggregationPeriod.DAY) + (AvgRange/2) else double.nan;
plot ADR_L = if GetLastDay() - GetDay() <= Days_to_Plot + 1 then open(period = AggregationPeriod.DAY) - (AvgRange/2) else double.nan;
 
Solution

Join useThinkScript to post your question to a community of 21,000+ developers and traders.

@childishtey this should work.

Ruby:
input lenght = 21;
input Days_to_Plot = 3;

def dayHigh = DailyHighLow(AggregationPeriod.DAY).Dailyhigh;
def dayLow = DailyHighLow(AggregationPeriod.DAY).DailyLow;
def dayrange = dayHigh - dayLow;
def AvgRange = Average(dayrange, lenght);

plot ADR_H = if GetLastDay() - GetDay() <= Days_to_Plot + 1 then open(period = AggregationPeriod.DAY) + (AvgRange/2) else double.nan;
plot ADR_L = if GetLastDay() - GetDay() <= Days_to_Plot + 1 then open(period = AggregationPeriod.DAY) - (AvgRange/2) else double.nan;

This did work!! Thank you!
 
@childishtey this should work.

Ruby:
input lenght = 21;
input Days_to_Plot = 3;

def dayHigh = DailyHighLow(AggregationPeriod.DAY).Dailyhigh;
def dayLow = DailyHighLow(AggregationPeriod.DAY).DailyLow;
def dayrange = dayHigh - dayLow;
def AvgRange = Average(dayrange, lenght);

plot ADR_H = if GetLastDay() - GetDay() <= Days_to_Plot + 1 then open(period = AggregationPeriod.DAY) + (AvgRange/2) else double.nan;
plot ADR_L = if GetLastDay() - GetDay() <= Days_to_Plot + 1 then open(period = AggregationPeriod.DAY) - (AvgRange/2) else double.nan;

@Svanoy - can I get your help again real quick? please.

The ADR plot works fine and I like how I can manually choose the days I want it to show, but I'm still having trouble with making study show ONLY today's current trading day. The Days_To_Plot input still shows me the previous days ADR even if I select '0'

I tried to tweak the study to 'ShowDay' or 'GetDay' -- but the ADR plot still shows me the previous day.


You see in the picture below how yesterday's (11/21/2022) ADR plot is showing. Do you know how to get the ADR plot to just show today's current trading + manually still choose the days I want?
16486[/ATTACH]']
aGKNAiZ.jpg
 

Attachments

  • aGKNAiZ.jpg
    aGKNAiZ.jpg
    84.1 KB · Views: 94
Last edited:
@childishtey like this, maybe?
Ruby:
input lenght = 21;
input Days_to_Plot = 3;

def dayHigh = DailyHighLow(AggregationPeriod.DAY).Dailyhigh;
def dayLow = DailyHighLow(AggregationPeriod.DAY).DailyLow;
def dayrange = dayHigh - dayLow;
def AvgRange = Average(dayrange, lenght);

plot ADR_H = if GetLastDay() - GetDay() <= Days_to_Plot + 1 then open(period = AggregationPeriod.DAY) + (AvgRange/2) else double.nan;
plot ADR_L = if GetLastDay() - GetDay() <= Days_to_Plot + 1 then open(period = AggregationPeriod.DAY) - (AvgRange/2) else double.nan;

plot Current_Range_H = if GetLastDay()==GetDay() then open(period = AggregationPeriod.DAY) + (DayRange/2) else double.nan;
plot Current_Range_L = if GetLastDay()==GetDay() then open(period = AggregationPeriod.DAY) - (DayRange/2) else double.nan;

Hey, come to find out the original ADR script you made DID work and do exactly what I needed it to do!
All I needed to do was set the Days_To_Plot input to '-1' and it did plot only today's ADR without showing me all the others days too, which is exactly what I was looking for.

Thanks for your help with this script. Very much appreciate it!!
 
Thread starter Similar threads Forum Replies Date
J auto plot ADR on chart for day trader. Questions 6
T Taking ADR further Questions 0
T Price approaching ADR levels scan Questions 9
J i need a help with ADR% scan. Questions 2
M adr Questions 3

Similar threads

Not the exact question you're looking for?

Start a new thread and receive assistance from our community.

87k+ Posts
629 Online
Create Post

Similar threads

Similar threads

The Market Trading Game Changer

Join 2,500+ subscribers inside the useThinkScript VIP Membership Club
  • Exclusive indicators
  • Proven strategies & setups
  • Private Discord community
  • ‘Buy The Dip’ signal alerts
  • Exclusive members-only content
  • Add-ons and resources
  • 1 full year of unlimited support

Frequently Asked Questions

What is useThinkScript?

useThinkScript is the #1 community of stock market investors using indicators and other tools to power their trading strategies. Traders of all skill levels use our forums to learn about scripting and indicators, help each other, and discover new ways to gain an edge in the markets.

How do I get started?

We get it. Our forum can be intimidating, if not overwhelming. With thousands of topics, tens of thousands of posts, our community has created an incredibly deep knowledge base for stock traders. No one can ever exhaust every resource provided on our site.

If you are new, or just looking for guidance, here are some helpful links to get you started.

What are the benefits of VIP Membership?
VIP members get exclusive access to these proven and tested premium indicators: Buy the Dip, Advanced Market Moves 2.0, Take Profit, and Volatility Trading Range. In addition, VIP members get access to over 50 VIP-only custom indicators, add-ons, and strategies, private VIP-only forums, private Discord channel to discuss trades and strategies in real-time, customer support, trade alerts, and much more. Learn all about VIP membership here.
How can I access the premium indicators?
To access the premium indicators, which are plug and play ready, sign up for VIP membership here.
Back
Top