
Thanks to BenTen's assembling skills, I bring you this indicator. I haven't named it yet, but it revolves around the RSI coming up from O/S to 34 and coming down from O/B to 66.... while the MACD crosses at the same exact time. I got this idea from Chad Brinkman's Youtube channel. He is a day trader. Check out these 3 vids to get an idea of where this came from:
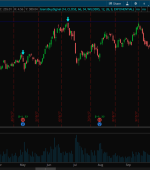
Here is what the indicator looks like


This works on all timeframes. You can edit the MACD lengths and RSI O/S and O/B levels as you please. The indicator came hot off the script plate from BenTen with standard MACD settings but as I backtested, I realized I needed something faster. I ended up using Chad's faster settings of 6,9,and13 for MACD. As for the RSI, it's my understanding that 34/66 or 35/65 levels are pretty much equal in terms of signal quality.
Please play around with this and post your thoughts here.
Indicator: https://tos.mx/wyPd1m
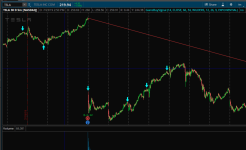
Here is what the indicator looks like
This works on all timeframes. You can edit the MACD lengths and RSI O/S and O/B levels as you please. The indicator came hot off the script plate from BenTen with standard MACD settings but as I backtested, I realized I needed something faster. I ended up using Chad's faster settings of 6,9,and13 for MACD. As for the RSI, it's my understanding that 34/66 or 35/65 levels are pretty much equal in terms of signal quality.
Please play around with this and post your thoughts here.
Indicator: https://tos.mx/wyPd1m
Code:
plot Data = close;
# MACD+RSI 34 Trading Indicator
# Assembled by BenTen at useThinkScript.com
# Concept shared by @Ohta via Discord
# You are free to use this code for personal use, and make derivative works from it. You are NOT GRANTED permission to use this code (or derivative works) for commercial purposes which includes and is not limited to selling, reselling, or packaging with other commercial indicators. Headers and attribution in this code should remain as provided, and any derivative works should extend the existing headers.

# RSI
input length = 14;
input price = close;
input over_Bought = 66;
input over_Sold = 34;
input RSIaverageType = AverageType.WILDERS;
def NetChgAvg = MovingAverage(RSIaverageType, price - price[1], length);
def TotChgAvg = MovingAverage(RSIaverageType, AbsValue(price - price[1]), length);
def ChgRatio = if TotChgAvg != 0 then NetChgAvg / TotChgAvg else 0;
def RSI = 50 * (ChgRatio + 1);
def OverSold = over_Sold;
def OverBought = over_Bought;

def RSIup = RSI crosses above OverSold;
def RSIdwn = RSI crosses below OverBought;

input fastLength = 6;
input slowLength = 9;
input MACDLength = 12;
input averageType = AverageType.EXPONENTIAL;

def Value = MovingAverage(averageType, close, fastLength) - MovingAverage(averageType, close, slowLength);
def Avg = MovingAverage(averageType, Value, MACDLength);

def Diff = Value - Avg;
def ZeroLine = 0;

def UpSignal = Diff crosses above ZeroLine;
def DwnSignal = Diff crosses below ZeroLine;

plot bullish = UpSignal and RSIup;
bullish.SetPaintingStrategy(PaintingStrategy.BOOLEAN_ARROW_UP);
bullish.SetDefaultColor(Color.CYAN);
bullish.SetLineWeight(3);

plot bearish = DwnSignal and RSIdwn;
bearish.SetPaintingStrategy(PaintingStrategy.BOOLEAN_ARROW_DOWN);
bearish.SetDefaultColor(Color.CYAN);
bearish.SetLineWeight(3);
Attachments
Last edited by a moderator: