Absolute Strength Histogram for ThinkorSwim

superbvictory

New member
I have a question to see if anyone knows if Thinkorswim has a preset function to set up an absolute strength indicator? They are two lines cross confirmation indicators. One is called absolute strength oscillator and the other is absolute strength histogram. If they already exists, where do I find them to test them out and if not how can I start working on building a custom script.

I tried to look for the codes and here is where I found some references:
Thanks in advance:)
 
@diazlaz - Definitely my favorite trend indicator. Appreciate the work. Question...I've been trying to build a scan for the flip from bullish to bearish and bearish to bullish and can't make it work. I've put hundreds of scans together, but can't figure out what I'm not doing with the Absolute Strength indicator. Any help would be appreciated. I keep getting an "Unexpected error has happened" message. Thanks again
I got the errors also. Try using the script in the first post of this thread for your scan query. It should return similar results.
 
I haven't tested it, but I think there is some value in the EXP version of the MA.

Here is my port:

Ruby:
#TITLE
#Absolute Strength Histogram for TOS
#PRC_Absolute Strength | indicator

#DESCRIPTION
#The Absolute Strength indicator indicates the current market “strength”
#in two different ways possible RSI Method and Stochastic Method
#and by separating the bulls and bears into 2 curves.
#
#The results are then averaged with the same “length” as the one used for
#these 2 above methods and smoothed a second time using the “Smooth” variable.
#The moving average mode used is by default the Weighted one.

#CREDITS
#https://www.prorealcode.com/prorealtime-indicators/absolute-strength/
#https://www.prorealcode.com/user/nicolas/


#CHANGELOG
#2019.11.01 @diazlaz Initial Port

declare lower;

#INPUT INDICATOR
input mode = {default RSI, Stoch}; #0-RSI method 1-Stoch method
input length = 9; #length
input smooth = 1; #period of smoothing factor
input modema = {default wma, exp, sma};
input price = close; # price data

#LOGIC
def price1 = price;
def price2 = price[1];

def Bulls;
def Bears;

switch (mode) {
case RSI:
    Bulls = 0.5*(AbsValue(Price1-Price2)+(Price1-Price2));
    Bears = 0.5*(AbsValue(Price1-Price2)-(Price1-Price2));
case Stoch:
    Bulls = price1 - Lowest(low, length);
    Bears = Highest(high, length) - price1;
}

def AvgBulls;
def AvgBears;
def SmthBulls;
def SmthBears;
switch (modema) {
case wma:
    AvgBulls = WMA(Bulls, length);
    AvgBears = WMA(Bears, length);
    SmthBulls = WMA(AvgBulls, smooth);
    SmthBears = WMA(AvgBears, smooth);
case exp:
    AvgBulls = ExpAverage(Bulls, length);
    AvgBears = ExpAverage(Bears, length);;
    SmthBulls = ExpAverage(AvgBulls, smooth);
    SmthBears = ExpAverage(AvgBears, smooth);
case sma:
    AvgBulls = Average(Bulls, length);
    AvgBears = Average(Bears, length);;
    SmthBulls = Average(AvgBulls, smooth);
    SmthBears = Average(AvgBears, smooth);
}


#PLOTS
plot pSmthBulls = SmthBulls;
pSmthBulls.AssignValueColor(COLOR.UPTICK);
pSmthBulls.SetPaintingStrategy(PaintingStrategy.HISTOGRAM);

plot pSmthBears = SmthBears;
pSmthBears.AssignValueColor(COLOR.DOWNTICK);
pSmthBears.SetPaintingStrategy(PaintingStrategy.HISTOGRAM);

plot pSmthBullsL = SmthBulls;
pSmthBullsL.AssignValueColor(COLOR.GREEN);
pSmthBullsL.SetLineWeight(2);

plot pSmthBearsL = SmthBears;
pSmthBearsL.AssignValueColor(COLOR.RED);
pSmthBearsL.SetLineWeight(2);


#COLORCANDLES
input showColorBars = yes;
AssignPriceColor(
if !showColorBars then
Color.CURRENT
else
if SmthBulls > SmthBears then COLOR.GREEN
else
COLOR.RED
);
is posible to add the ADX inside this 2 bands?
 
I haven't tested it, but I think there is some value in the EXP version of the MA.

Here is my port:

Ruby:
#TITLE
#Absolute Strength Histogram for TOS
#PRC_Absolute Strength | indicator

#DESCRIPTION
#The Absolute Strength indicator indicates the current market “strength”
#in two different ways possible RSI Method and Stochastic Method
#and by separating the bulls and bears into 2 curves.
#
#The results are then averaged with the same “length” as the one used for
#these 2 above methods and smoothed a second time using the “Smooth” variable.
#The moving average mode used is by default the Weighted one.

#CREDITS
#https://www.prorealcode.com/prorealtime-indicators/absolute-strength/
#https://www.prorealcode.com/user/nicolas/


#CHANGELOG
#2019.11.01 @diazlaz Initial Port

declare lower;

#INPUT INDICATOR
input mode = {default RSI, Stoch}; #0-RSI method 1-Stoch method
input length = 9; #length
input smooth = 1; #period of smoothing factor
input modema = {default wma, exp, sma};
input price = close; # price data

#LOGIC
def price1 = price;
def price2 = price[1];

def Bulls;
def Bears;

switch (mode) {
case RSI:
    Bulls = 0.5*(AbsValue(Price1-Price2)+(Price1-Price2));
    Bears = 0.5*(AbsValue(Price1-Price2)-(Price1-Price2));
case Stoch:
    Bulls = price1 - Lowest(low, length);
    Bears = Highest(high, length) - price1;
}

def AvgBulls;
def AvgBears;
def SmthBulls;
def SmthBears;
switch (modema) {
case wma:
    AvgBulls = WMA(Bulls, length);
    AvgBears = WMA(Bears, length);
    SmthBulls = WMA(AvgBulls, smooth);
    SmthBears = WMA(AvgBears, smooth);
case exp:
    AvgBulls = ExpAverage(Bulls, length);
    AvgBears = ExpAverage(Bears, length);;
    SmthBulls = ExpAverage(AvgBulls, smooth);
    SmthBears = ExpAverage(AvgBears, smooth);
case sma:
    AvgBulls = Average(Bulls, length);
    AvgBears = Average(Bears, length);;
    SmthBulls = Average(AvgBulls, smooth);
    SmthBears = Average(AvgBears, smooth);
}


#PLOTS
plot pSmthBulls = SmthBulls;
pSmthBulls.AssignValueColor(COLOR.UPTICK);
pSmthBulls.SetPaintingStrategy(PaintingStrategy.HISTOGRAM);

plot pSmthBears = SmthBears;
pSmthBears.AssignValueColor(COLOR.DOWNTICK);
pSmthBears.SetPaintingStrategy(PaintingStrategy.HISTOGRAM);

plot pSmthBullsL = SmthBulls;
pSmthBullsL.AssignValueColor(COLOR.GREEN);
pSmthBullsL.SetLineWeight(2);

plot pSmthBearsL = SmthBears;
pSmthBearsL.AssignValueColor(COLOR.RED);
pSmthBearsL.SetLineWeight(2);


#COLORCANDLES
input showColorBars = yes;
AssignPriceColor(
if !showColorBars then
Color.CURRENT
else
if SmthBulls > SmthBears then COLOR.GREEN
else
COLOR.RED
);
This is one of my favorite indicator, thank you so much for all the programmers and developers to this community. Their talent and their creativity is greatly appreciated. I would like to make a request regarding the color candles (paint bars) to make gray color when the strength is below 2. Of course, red when the strength is red and green when the strength is green when it is above 2. Thank you so much in advance.
 
Last edited by a moderator:
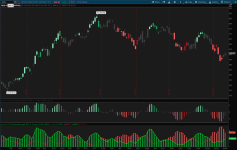
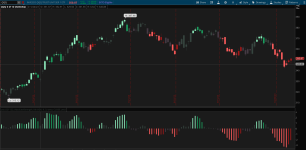
Hi all... I've made a number of adjustments to the latest version posted here. Specifically:
  1. Make the histogram easier to visualise the positive and negative market strength
  2. Plotting the net difference between Bulls and Bears to and incorporated a relative strenght to indicate if the market strength is sizeable or trading sideways.
  3. Added in coloring based on the increases or decreases in strength
  4. Added in an ADX option in addition to the RSI and Stoch.
  5. Added Sensitivity adjustment feature.
The image below includes both this new version, and the previous one for reference. Please let me know what you think.

Code below:

#TITLE
#Absolute Strength Histogram for TOS
#PRC_Absolute Strength | indicator

#DESCRIPTION
#The Absolute Strength indicator indicates the current market “strength”
#in two different ways possible RSI Method and Stochastic Method
#and by separating the bulls and bears into 2 curves.
#
#The results are then averaged with the same “length” as the one used for
#these 2 above methods and smoothed a second time using the “Smooth” variable.
#The moving average mode used is by default the Weighted one.

#CREDITS
#https://www.prorealcode.com/prorealtime-indicators/absolute-strength/
#https://www.prorealcode.com/user/nicolas/


#CHANGELOG
#2019.11.01 @diazlaz Initial Port
#2023.1031 @jonesjb adjusted the port to:
#1. Make the histogram easier to visualise the positive and
#negative market strengths
#2. Plotting the net difference between Bulls and Bears to
#and incorporated a relative strenght to indicate if the
#market strength is sizeable or trading sideways.
#3. Added in coloring based on the increases or decreases
#in strength
#4. Added in an ADX option in addition to the RSI and Stoch.
#5. Added Sensitivity adjustment feature.

declare lower;


DefineGlobalColor("PUp", CreateColor(143, 239, 191));
DefineGlobalColor("PDown", CreateColor(26, 158, 94));
DefineGlobalColor("PNeutral", CreateColor(54, 69, 63));
DefineGlobalColor("NUp", CreateColor(163, 24, 24));
DefineGlobalColor("NDown", CreateColor(255, 92, 92));
DefineGlobalColor("NNeutral", CreateColor(69, 58, 68));


#INPUT INDICATOR
input mode = {default RSI, Stoch, ADX}; #0-RSI method 1-Stoch method
input length = 9; #length
input smooth = 3; #period of smoothing factor
input modema = {default wma, exp, sma};
input price = close; # price data
input Sensitivity = {"low", default "medium", "high", "Let's Get Nuts"}; #medium is the standard

def Sen;
switch (Sensitivity) {
case "low":
Sen = 1.5;
case "medium":
Sen = 1;
case "high":
Sen = .5;
case "Let's Get Nuts":
Sen = 0;
}

#LOGIC
def price1 = price;
def price2 = price[1];

def Bulls;
def Bears;

switch (mode) {
case RSI:
Bulls = 0.5 * (AbsValue(price1 - price2) + (price1 - price2));
Bears = 0.5 * (AbsValue(price1 - price2) - (price1 - price2));
case Stoch:
Bulls = price1 - Lowest(low, length);
Bears = Highest(high, length) - price1;
case ADX:
Bulls = 0.5 * (AbsValue(high - high[1]) + (high - high[1]));
Bears = 0.5 * (AbsValue(low[1] - low) + (low[1] - low));
}

def AvgBulls;
def AvgBears;
def SmthBulls;
def SmthBears;
switch (modema) {
case wma:
AvgBulls = WMA(Bulls, length);
AvgBears = WMA(Bears, length);
SmthBulls = WMA(AvgBulls, smooth);
SmthBears = WMA(AvgBears, smooth);
case exp:
AvgBulls = ExpAverage(Bulls, length);
AvgBears = ExpAverage(Bears, length);
;
SmthBulls = ExpAverage(AvgBulls, smooth);
SmthBears = ExpAverage(AvgBears, smooth);
case sma:
AvgBulls = Average(Bulls, length);
AvgBears = Average(Bears, length);
;
SmthBulls = Average(AvgBulls, smooth);
SmthBears = Average(AvgBears, smooth);
}


#PLOTS
plot pSmthBulls = if SmthBulls >= SmthBears then SmthBulls - SmthBears else Double.NaN;
pSmthBulls.AssignValueColor (if
(SmthBulls - SmthBears) >= (SmthBears * Sen) and (SmthBulls - SmthBears) > (SmthBulls[1] - SmthBears[1]) then (GlobalColor("Pup")) else if
(SmthBulls - SmthBears) >= (SmthBears * Sen) and (SmthBulls - SmthBears) <= (SmthBulls[1] - SmthBears[1]) then (GlobalColor("Pdown"))
else (GlobalColor("PNeutral")));
pSmthBulls.SetPaintingStrategy(PaintingStrategy.HISTOGRAM);
pSmthBulls.HideBubble();
pSmthBulls.HideTitle();

plot pSmthBears = if SmthBears > SmthBulls then SmthBulls - SmthBears else Double.NaN;
pSmthBears.AssignValueColor (if
(SmthBears - SmthBulls) > (SmthBulls * Sen) and (SmthBears - SmthBulls) > (SmthBears[1] - SmthBulls[1]) then (GlobalColor("NDown")) else if
(SmthBears - SmthBulls) > (SmthBulls * Sen) and (SmthBears - SmthBulls) <= (SmthBears[1] - SmthBulls[1]) then (GlobalColor("NUp"))
else (GlobalColor("NNeutral")));
pSmthBears.SetPaintingStrategy(PaintingStrategy.HISTOGRAM);
pSmthBears.HideBubble();
pSmthBears.HideTitle();


def pSmthBullsL = SmthBulls;
#pSmthBullsL.AssignValueColor(Color.GREEN);
#pSmthBullsL.SetLineWeight(2);

def pSmthBearsL = SmthBears;
#pSmthBearsL.AssignValueColor(Color.RED);
#pSmthBearsL.SetLineWeight(2);

#COLORCANDLES
input showColorBars = no;
AssignPriceColor(
if !showColorBars then
Color.CURRENT
else if
SmthBulls > SmthBears and ((SmthBulls - SmthBears) > (SmthBears * Sen)) and (SmthBulls - SmthBears) > (SmthBulls[1] - SmthBears[1]) then (GlobalColor("Pup"))
else if
SmthBulls > SmthBears and ((SmthBulls - SmthBears) > (SmthBears * Sen)) and (SmthBulls - SmthBears) <= (SmthBulls[1] - SmthBears[1]) then (GlobalColor("Pdown"))
else if
SmthBulls > SmthBears then (GlobalColor("PNeutral")) else if

SmthBears > SmthBulls and ((SmthBears - SmthBulls) > (SmthBulls * Sen)) and (SmthBears - SmthBulls) > (SmthBears[1] - SmthBulls[1]) then (GlobalColor("NDown"))
else if
SmthBears > SmthBulls and ((SmthBears - SmthBulls) > (SmthBulls * Sen)) and (SmthBears - SmthBulls) <= (SmthBears[1] - SmthBulls[1]) then (GlobalColor("NUp"))
else if
SmthBears > SmthBulls then (GlobalColor("NNeutral"))
else
Color.YELLOW
);
 

Attachments

  • Screenshot 2023-11-01 at 12.00.35 AM.png
    Screenshot 2023-11-01 at 12.00.35 AM.png
    219.9 KB · Views: 130
  • Screenshot 2023-11-01 at 12.01.58 AM.png
    Screenshot 2023-11-01 at 12.01.58 AM.png
    114.9 KB · Views: 121

Join useThinkScript to post your question to a community of 21,000+ developers and traders.

Similar threads

Not the exact question you're looking for?

Start a new thread and receive assistance from our community.

87k+ Posts
364 Online
Create Post

Similar threads

Similar threads

The Market Trading Game Changer

Join 2,500+ subscribers inside the useThinkScript VIP Membership Club
  • Exclusive indicators
  • Proven strategies & setups
  • Private Discord community
  • ‘Buy The Dip’ signal alerts
  • Exclusive members-only content
  • Add-ons and resources
  • 1 full year of unlimited support

Frequently Asked Questions

What is useThinkScript?

useThinkScript is the #1 community of stock market investors using indicators and other tools to power their trading strategies. Traders of all skill levels use our forums to learn about scripting and indicators, help each other, and discover new ways to gain an edge in the markets.

How do I get started?

We get it. Our forum can be intimidating, if not overwhelming. With thousands of topics, tens of thousands of posts, our community has created an incredibly deep knowledge base for stock traders. No one can ever exhaust every resource provided on our site.

If you are new, or just looking for guidance, here are some helpful links to get you started.

What are the benefits of VIP Membership?
VIP members get exclusive access to these proven and tested premium indicators: Buy the Dip, Advanced Market Moves 2.0, Take Profit, and Volatility Trading Range. In addition, VIP members get access to over 50 VIP-only custom indicators, add-ons, and strategies, private VIP-only forums, private Discord channel to discuss trades and strategies in real-time, customer support, trade alerts, and much more. Learn all about VIP membership here.
How can I access the premium indicators?
To access the premium indicators, which are plug and play ready, sign up for VIP membership here.
Back
Top